Insights to Accelerate International Expansion
Export Treasure Chest
Our Mission: Help Manufacturers “Spend time Selling to Distributors versus Searching for Distributors”
In This Issue
About Export Solutions
Export Solutions is a leader in export
development and distributor identification
services for the food, beverage,
confectionery and consumer goods
industries. We’ve worked as consultants
on more than 300 export projects in
96 countries and 5 continents. Our “sales
oriented” approach focuses on practical
solutions to get your product on the shelf in
supermarkets around the world. For more
information visit www.exportsolutions.com
Export Solutions has helped more than 2,700
export managers “Spend time selling to
distributors vs. searching for distributors.”
Page 3
“The Right Way” – New Country Launch
Page 24
Country Segmentation –
One Size Does Not Fit All
Page 34
10 Step Distributor Search Process
Page 42
Export Distributor Data Sheet
Page 48
Export Solutions
Distributor Assessment Grid
Pages 67-68
Category Review Template
Export success has become
complicated, with many requirements
beyond a “handshake deal” with a
promising distributor. Management
demands a strategic plan guiding
your export priorities. Finding strong
partners must include an extensive
due diligence process. Our annual
plan cycle features a category review,
price survey, and marketing proposal
summary. Many export managers
create templates to share information
on these fundamental components of
export development.
Why recreate the wheel?
Export Solutions is pleased to launch
our 2022 Export Treasure Chest.
This guide shares our most popular
templates and charts all in one
convenient document. These tools
supply “best practice” formats for
many aspects of building a strategic
export business. Templates cover
Country Segmentation, Distributor
Search, In-Store Management and
Business Planning.
Export Solutions publishes our
Treasure Chest free as a service to our
industry. Export Solutions philosophy
is to serve as a trusted “helper” and
friend to all in the global export
community. Sharing our proprietary
templates validates our proven
distributor search consulting
methodology. Subscribers to our
distributor database may also obtain
Word versions of key templates to
easily adapt for your own company’s
use. “What’s measured is treasured.”
Enjoy Export Solutions’ Treasure Chest!
Export Solutions’ Favorite Templates & Charts
3 How to Excite Buyers
3 Country Segmentation Grid
3 10 Step Distributor Search Process
3 Distributor Data Sheet
3 Category Review Template
3 Distributor Assessment Grid
Greg's Favorite Templates & Charts
Export Solutions’ New Distributor Checklist
____ Contract/Agreement
____ Price Calculation Model
____ Business Plan: objectives, marketing,
spending, key dates
____ Category Review: Pricing, Shelf,
Assortment, Merchandising
____ Label Compliance
____ Shelf Life
____ Order Lead Time
____ Minimum Order
____ Pick up Point
____ Payment Terms
____ Payment Currency
____ Damage Policy
____ Product Registration
____ Forecast: Year 1
____ Pipeline Order & Inventory
____ Brand Facts
____ Product Samples
____ Appointment Letter
____ Brand Specifications in System:
Distributor & Customers
____ Training: Key Account Managers,
Retail, Administrative Staff, Warehouse
____ In Store Standards: Pricing, Shelf
Management, Merchandising
____ FAQ’s/Handling Common Objections
____ Key Account Presentation
____ Customer Appointment Dates
____ Category/Business Review:
Tailored to Each Key Account
____ Retail Sales Contest
____ Checkpoint Calls
____ Market Audit Date
____ Reporting: Track Distribution, Pricing,
Shelf Positioning, Merchandising, etc.
5 Critical Questions to Thrive in 2025
1. Are we willing to pursue international acquisitions?
2. Would your company consider overseas contract packing (versus export)?
3. Can we test a high spend investment plan (“The Right Way”) in a strategic country?
4. Would your company invest aggressively in offshore head count in advance of sales?
5. Europeans: can we develop the USA market implementing the USA playbook? USA factory,
broker network, competitive pricing, USA team, channel strategy, 30-50% trade promotions?
2
3
“The Right Way” – New Country Launch
Retail buyers and distributors are receptive to brand launches from multinationals. Why?
Multinationals succeed, as they introduce new products “The Right Way.” Export Solutions recaps
30 components of launching “The Right Way.” Exporters create magic with limited budgets!
Winners check as many boxes as possible on “The Right Way” scorecard.
Product Retailer
o Meaningful innovation – not “me too” o Boost category sales, margin, and profit
o Consumer market research insights o Syndicated data (Nielsen) – category facts
o Technical confirmation of product differentiation o Invest in retailer “push” programs
o Reasonable retail price – premium (not sky high) o 4-6 high value promotional events per year
o Test market results – similar country or retailer o Retailer VP, distributor CEO at intro call
Marketing Excitement
o 360 marketing plan: TV, in-store, social, PR o Launch party – memorable location
o Sampling o PR, social media, trade press
o Social media o Celebrity endorsement
o Displays: end of aisle and shelf blocks o Distributor sales contest
o Special offers – retailer fliers o Donation to local charity
Team Scorecard
o Distributor – best in class, category expert o Year 1: invest; year 2: break even; year 3: profit
o Local manager – launch oversight o Sales volume (retail sell-out)
o Marketing, social media, PR agencies o Market share
o Brand/technical resource from headquarters o Retail availability (weighted distribution)
o Total distributor engagement: reps. to CEO o Year 2 commitment and enthusiasm
4
How to be Distributor of the Year
Assessment Criteria Considerations
Rating:
(10 = Best)
Results vs Plan, Market, Category • Reliable, 5 to 10% + growth
Retail Store Conditions • Brand presence exceeds market share
Brand Manager • “A” player, dedicated resource
Cost to Serve • Fair margin, based upon size, complexity
Omni Channel • Channel teams, e-commerce focus
Fun • Do you enjoy the people, country?
Financial • Prompt payments, accurate billbacks
Problem Solving – Response Time • Same day service, sense of urgency
CEO • Loves your brand, engaged
Pioneers New Business • From concept to cases
Supply Chain Management & Forecasting • Accurate, efficient
Customer Relations • Senior access at top retailers
Category Knowledge • Viewed as expert by buyers
Profitable Partner • Sells profitable cases
Analytical Skills: Shipments, Nielsen • Trends, opportunities, plan
Team (Finance, IT, Logistics) • Cross functional expertise
Digital Savvy • Social Media team, pioneers new tools
Reporting • On time, complete, accurate
Best Practices • Creative idea source for other markets
Cultural Alignment • Perfect fit with brand owner’s vision
5
Export Manager Report Card
Assessment Criteria Considerations
Rating:
(10 = Best)
Annual Plan Development, Execution, Delivery • Aligned, reliable, committed
Export Experience – Food/Consumer Products • New to 20 years +
Ability to Influence Distributors • Focus on your priorities
Pioneers New Business • From concept to containers
Work Ethic • Office time vs. overseas trips?
International Citizenship • Language skills, cultural alignment
Category Knowledge • Viewed as expert: buyers, distributors
Business Leadership • Partners with internal functions
Distributor Relationships • From sales reps. to owner
Thought Leadership • Creates and shares best practices
Export Strategy • Logical vision and road map
Profitable, Sustainable, Exports • Sells profitable cases
Retail Store Conditions • Brand presence vs. market share?
Brand Building – Promotions • Creativity, effectiveness, efficiency
Problem Solving – Response Time • Same day to one week?
Customer Relations • Senior access at top retailers
Analytical Skills: Shipments, Nielsen • Trends, opportunities, plan
Digital Savvy • E-commerce, social media
Supply Chain Management & Forecasting • Accuracy and efficiency
Results vs Budget, Market,
Category (CY, PY, 3 Years)
• Flat to 10% +
6
Are Distributors Interested in Your Brand?
High Interest Low Interest
Email Response
Immediate reply Delayed or no reply
CEO Engagement
Active participation Delegated to middle management
Scheduling Meeting
Flexible and easy Difficult. Conflicts.
Airport/Hotel Pick-Up
Offers to pick you up Take a taxi!
Meeting Presentation
Tailored. Prepared for you. Standard presentation
Category Research
Obtains data None
Competitive Review
Shares photos: store sets Informal comments
Store Visits
Organized/led by CEO Office meeting only
Samples
Obtains and tries samples Waits for you
Team Participation
3-6 people at meeting One person
Cell Phone
Shares private number Email address only
Questions
Addresses key issues No questions
Timeline
Meets due dates Delays
Post Meeting Follow-up
Immediate and frequent None
Proposed Plan
Detailed and fact based Brief topline
Results Winner Second place?
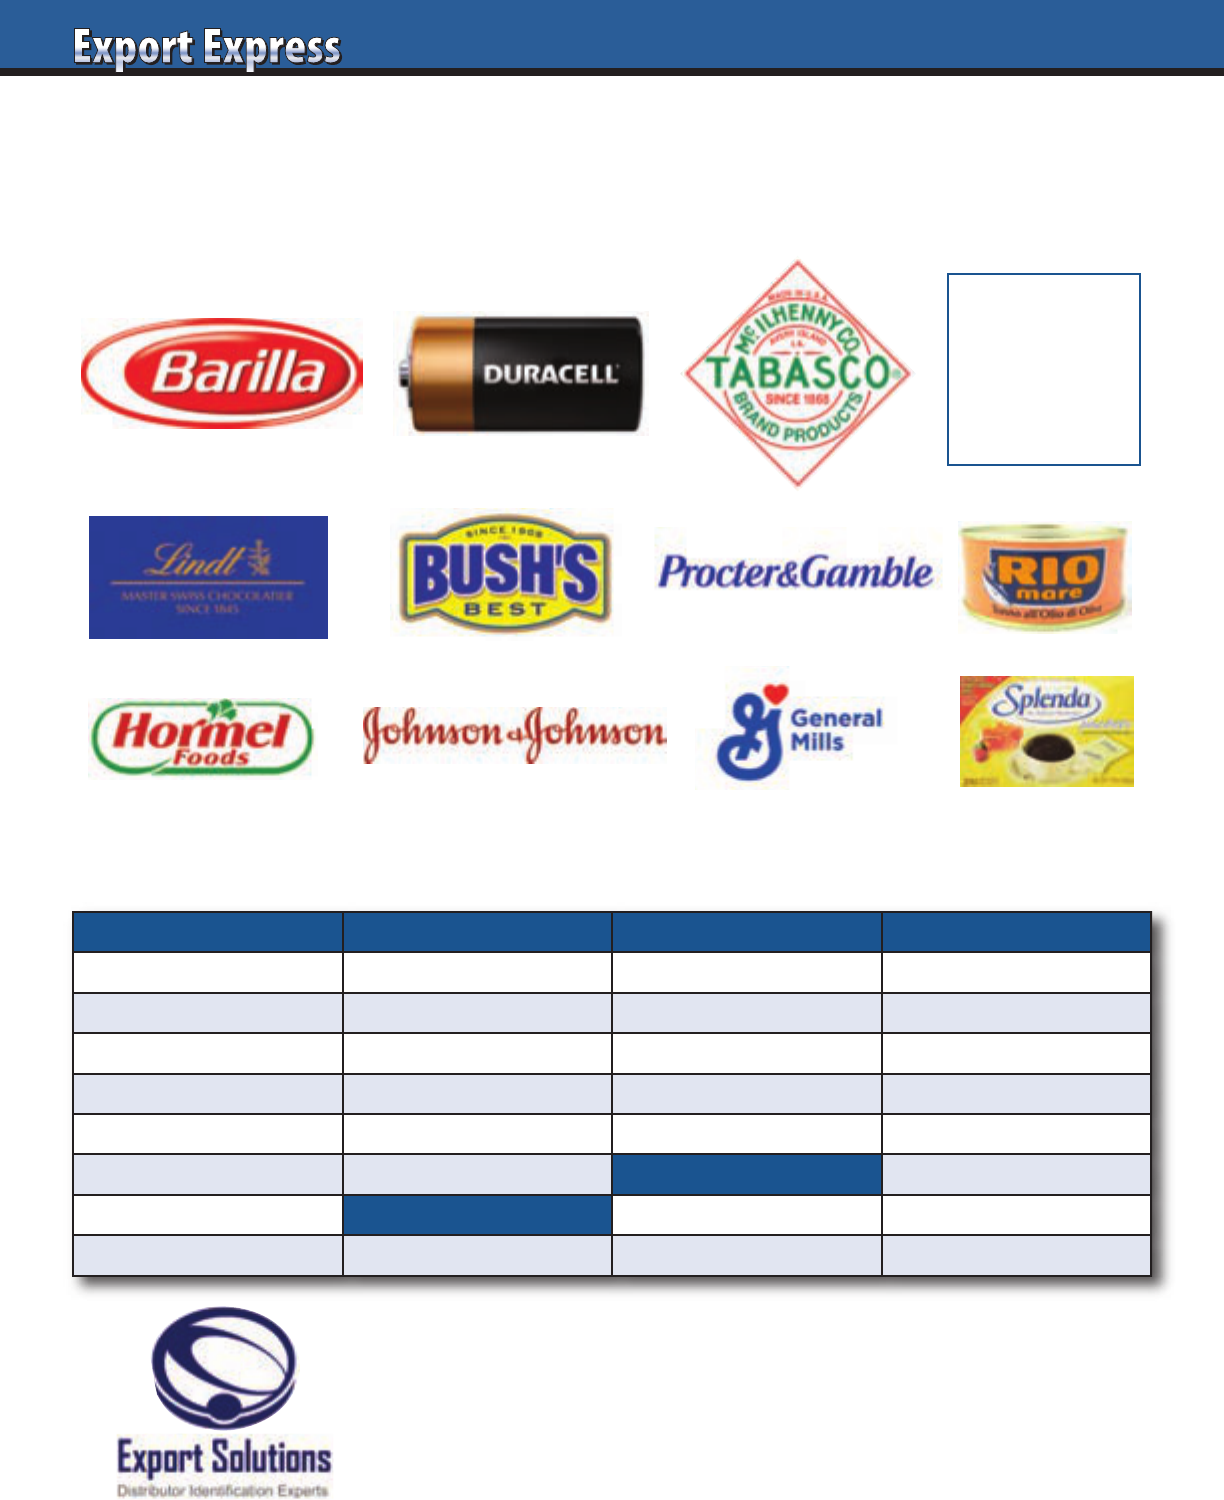
I have conducted hundreds of distributor interviews for multinational companies: P&G, Nestle, General Mills,
Duracell, Lindt, Tabasco, Barilla, J&J, etc. Distributor candidates all claim enthusiasm and high interest in your
brand. See Export Solutions’ checklist of clues to measure true distributor interest level.
7
30 Ideas to Help your Distributors
1. Trade Promotion
Share Best Practice Trade Promotion concepts
16. Innovation
Launch new items with successful track record
2. Celebrate Success
Distributor of the Year Awards
17. Sales Contest
Fund contest to incent and motivate distributor team
3. Category Expert
Provide fact based trend updates
18. Thank You Letter
Letter of recognition for team to distributor CEO
4. Logistics Service Level
Target 98% on time, complete orders
19. Event Sponsorship
Support distributor events, especially retailers’ charities
5. Store Check
Periodic visits to understand “retail reality”
20. Distributor Workload
Work proportional to distributor income
6. Billback Reimbursement
Prompt (30 days?) payment of distributor invoices
21. Price Increase
Provide fair lead time for price increases
7. Distributor CEO
Regular (quarterly?) checkpoint web meetings
22. Reference
Write testimonial or volunteer to serve as reference
8. Response Time
Earn reputation as “quick responder”
23. Training
Create Zoom training session for sales team
9. Marketing
Support distributor’s ideas. Invests in creative programs.
24. Portal
Create Portal with presentations, brand facts, digital tools
10. Customers
Do not deal directly with distributor’s customers
25. Social Media
Corporate experts available to help/share content
11. Reports
Stick to basics: sales, forecast, inventory, listing maps
26. VIP Trip Your Headquarters
Introduce distributor to your senior executives
12. Market Visits
Visit, but not too often
27. Samples
Support large sampling programs
13. Team Building
Create team relationship: finance, logistics, administration
28. Corporate Functional Experts
Provide distributor access to your corporate experts
14. Distributor Profit
Respect that a profitable distributor is a healthy distributor
29. Consumer Research
Conduct local research for consumer insights
15. Syndicated Data
Invest in Nielsen data
30. Create Culture of Success
Achieve joint business targets
8
Distributor Search Helper for:
Your
Logo
Here
Can We Help You?
Recent Distributor Search Projects
Asia Europe Middle East Latin America
Australia Germany Israel Argentina
China Ireland Kuwait Brazil
Indonesia Netherlands Qatar Colombia
Japan Nordics Saudi Arabia Costa Rica
Malaysia Spain UAE Ecuador
Philippines United Kingdom North America Mexico
Singapore Africa Canada Panama
South Korea South Africa United States Peru
Call the Export Accelerator!
Contact Greg Seminara at greg@exportsolutions.com
to discuss your business development project.
www.exportsolutions.com
9
Distributor 2022: New Skills for New Times
Priority Comments
E-Commerce
Treat as major channel, not niche.
Social Media
Hire digital marketing team, link with local influencers.
CEO Engagement
Regular Zoom calls with overseas brand owners.
Culture
Promote young, energetic spirit. Embrace change and new channels.
Category Specialization
Laser focus on core categories vs. products in every aisle of the store.
Training
Use Zoom tools for regular training events with brand owners.
Team
Hire under 30's for social media and e-commerce sales roles.
IT Investment
Upgrade platform: E-commerce, retail reporting, sell out data.
Cost to Serve
Measure profitability by brand and customer.
Realign based upon 2022 reality.
Market Your Distributor Brand
Promote your distributor brand to leading
companies in your core categories. Export Solutions can help!
Sampling
Aggressive investment in this A+ tool. Explore new sampling vehicles.
Brandscaping
Invest in a “Best in Class” web site. Create modern company profile.
Scorecard
Incorporate e-commerce metrics: Page 1 results, consumer feedback, etc.
Brand Managers
Reward creativity and marketing excellence, not paperwork completed.
Recipe
Promote meal solutions, not just brands.
Optimism
Be positive. Think, “why not?”
Results Exceed expectations everyday.
10
Export Manager 2022: New Skills for New Times
Priority Comments
E-Commerce
Treat as major channel, not niche.
Social Media
Create content library for distributors to “plug and play.”
Management Engagement
Zoom with distributor leadership team: CEO, CFO, VP Sales, etc.
Culture
Promote young, energetic spirit. Embrace change and new channels.
Category Specialization
Share category trends. Deliver product innovation, not “me too.”
Training
Use Zoom tools for regular distributor training events.
Team
Make your corporate functional experts available to your distributor team.
IT Investment
Upgrade platform: Brand portal, syndicated data, shipment status.
Cost to Serve
Measure contribution to distributor profit.
Look at pricing and margin vs. agreement.
Marketing Your Brand
Invest to adapt your global marketing plan to local conditions.
Sampling
Aggressive investment in this A+ tool. Explore new sampling vehicles.
Brandscaping
Invest in a “Best in Class” web site. Robust export resource page.
Scorecard
Monitor pricing/assortment at retailer web shops.
Incorporate e-commerce metrics in your distributor scorecard.
Brand Managers
Demand young digitally savvy brand managers.
Recipe
Promote meal solutions, not just brands. Look for co-promotion partners.
Optimism
Be positive. Think, “why not?”
Results Exceed expectations everyday.
11
Distributor E-Commerce Scorecard
Assessment Criteria Considerations
Rating:
(10 = Best)
Distributor CEO Commitment • Investment, engagement, and patience
E-Commerce as Percent Total Sales • How big is e-commerce for distributor?
E-Commerce 2021 Growth Rate • Results: 2021 trends? 3 year CAGR?
2022 E-Commerce Growth Objective • Benchmark versus overall country growth
E-Commerce Team • Dedicated? Experience? “A Players?”
E-Commerce Analysts • Dedicated or shared?
Digital Marketing Manager • Experience? Budget? Examples?
Logistics: Fulfillment Capability • Solution to deliver by unit?
Top E-Commerce Customers • Coverage, penetration?
Amazon: Treated as Key Account? • 2021 sales, trends, items listed
# Items Sold: Your Brand • Listed items at major retailer like Amazon
# Items on Page 1 or 2: Your Brand • Listed items on page 1 or page 2?
Your Brand Share: Page 1 or 2 • Category share of items on page 1 or page 2?
Category Sales Ranking: Your Brand • Sales rank for key items
# Customer Reviews: Your Brand • Total number of reviews for your brand
# Positive Reviews: Your Brand • Number/percent of 4 and 5 star reviews
Reputation Management • Responsiveness to consumer feedback
Percent Third Party Sales: Your Brand • Sales trends through 3rd party merchants
Special Packs • Capability to create e-commerce packs
Pricing: E-Commerce vs. Retail • Pricing equilibrium: retail and e-commerce
E-commerce development and digital marketing expertise is a top priority.
International distributors must establish a plan and demonstrate patience.
Are your distributors e-commerce leaders, performers, or laggards?
12
A big difference exists in export strategy for SMCG (Slow Moving Consumer Goods) and companies committed to FMCG Brand
Building (Fast Moving Consumer Goods). Either model is okay. Many companies are en route between SMCG and FMCG. Alignment
between aspiration, investment, and perspiration drives realistic outcomes.
Export Journey: SMCG to FMCG
SMCG FMCG
Aspirations Niche Participant Mass/Leader
Consumer
Homesick Upscale Local
Research
None Nielsen Consumer
Portfolio
Best sellers from
home market
Best sellers from
home market
Tailored to region
or country
Packaging
Standard packs stickered Multilingual
Local language label
and pack size
Factory
Corporate HQ Corporate HQ Offshore
Pricing
Super Premium Premium Competitive
Marketing
None Sampling, Digital
360 Plans
TV, Digital
Trade Spend
None 10-20% Discount
Ad, Display
20-30% Discount
Route to Market
Niche distributor Mid -size distributor
Mass distributor or
subsidiary
Country Focus
Adjacent
Homesick Expats
Mid-size countries
plus USA
All countries
USA, China, Brasil
Channels
E-Commerce
Homesick Expats
Supermarket
E-Commerce
All channels
Oversight
1 visit/year from HQ Regional manager Dedicated country manager
Complexity
Low Moderate High
13
20 Tips to Accelerate a Mature Business
Activity Strategy
Creative Promotions
Retailer specific events. Offer fresh ideas.
Distributor Brand Manager
Upgrade talent. Secure “A” players on your business.
Pricing
More profit through higher volume at lower price?
Country Manager
Hire local manager or assign HQ person for 3-6 months.
Local Production or Copacker
Lower cost structure with added complexity.
Brand Ambassadors
Hire team with “brand uniform” to sample at local events.
White Space – Distribution
Fill voids on retailer listing map: Top 10 customers.
Social Media
Partner with influencers. Targeted local investments.
New KPIs
New measures: Listing maps, shelf placement, etc.
E-commerce Development
Invest to lead in this emerging channel.
In-Store Visibility
Educate and measure team on in-store presence goals.
Sampling, Sampling, Sampling
Aggressive distribution of free sample size.
Distributor Team Linkage
Zoom/Teams contact with Key Account Managers, etc.
Launch NPD Innovation
Excite team to launch innovation “The Right Way.”
Distributor CEO
Treat CEO as VIP. Create special relationship.
Sponsorship
Support local events and retailer charities.
Sales Contest
Excite and motivate retail sales team.
Alternate Channel Focus
Small shops, foodservice, duty free, drug stores.
High Spend Test
Will heavy up marketing or trade discounts drive sales?
Distributor Change
Motivated new team, high energy to solve old problems.
14
Introducing
America’s Favorite Brands
Executive Board
Export Solutions Smucker’s Tabasco
Greg Seminara, CEO Danny Berrios, President Megan Lopez, Vice-President
General Mills Sun-Maid
Eric Saint-Marc Carsten Tietjen
Advisory Board
Bazooka Candy Blue Diamond Bob’s Red Mill
Santiago Ricaurte Dale Tipple Jan Chernus
Bush Beans Campbells Church & Dwight
Dave Bauman Julio Gomez Arun Hiranandani
Ferarra Candy Heartland Idahoan
Daniel Michelena Tom Theobald Ryan Ellis
Johnsonville Sausage Kao USA Keurig Dr. Pepper
Cory Bouck Julie Toole Billy Menendez
Mizkan Reynolds Welch’s
Noel David Chris Corey Marc Rosen
19 Companies | 200+ Top Brands | $80 Billion Combined
View our activities for export managers – www.usafoodexport.com
1515
Customer Relationship Assessment
All distributors claim strong relationships with their biggest customers. Below is Export Solutions’ template
for evaluating distributor key account relationships. Best way to evaluate distributor relationships? Your
company’s market share and volume growth at the customer versus the balance of the market!
Assessment Criteria Rating: (10 = Best)
Distributor viewed as an important supplier to the retailer/buyer
Open to bringing brand owner to customer meetings.
Ability to schedule buyer/CEO meetings outside the office.
Can negotiate standard listing fees and other program costs.
Pricing: access to price coordinator. Ability to make changes.
Shelf: access to decision maker. Space in excess of market share.
Merchandising Flier/Catalog: Ability to get prime feature space.
Relationship/access to retailer owners, senior executives.
Problem solving: rapid response? Emergency orders etc.
Payment terms.
Access to retailer movement data.
Category captain or “advisor” for my category.
Vendor awards?
Knowledge of retailers systems. “How to get things done.”
Sales results versus overall market and retailers internal growth.
1616
Preferred Supplier Scorecard
Distributors deliver their best results for their favorite principals. How do you rank?
Supplier Assessment Considerations
Rating:
(10 = Best)
Annual Sales Revenue • Percent of total distributor sales
Annual Profit Generated ($)
• Net sales times gross margin
Years of Service • New to 20 years or more
Compound Annual Growth Rate
• Flat to 10% or more
Supplier Investment Level • Zero to 25% of sales
Celebrates Success
• Awards, dinner, thank you notes
Shares Best Practices
• Serves as category expert
Logistics Service Level
• Target 98% on time, complete orders
Visits Retail Stores
• Never to full day every visit
Reimbursement of Billbacks • 2 weeks to 3 months
Senior Management Relationship • None to long term partners
Export Manager Experience • New hire to 10 years or more
Response Time • Same day to one month
Supports Distributor’s Ideas
• Invests in local ideas
Good on Customer Calls
• Avoids calls to customer favorite
Admin Requirements • Orders only to multiple reports
Supplier Visit Frequency • Never to weekly
Relationship: Entire Team • Finance, logistics, administration
Respects Fair Profit for Distributor • Healthy distributor is profitable
Achieves Joint Business Targets • Creates culture of success
1717
Distributor Search Best Practices
Activity Bad Practice Best Practice
Distributor Profile No portfolio synergies.
Representing similar size,
premium brands from your
aisle/country.
Candidate Model
Agent or third party not based
in destination country.
Distributor of international,
third party brands.
Web Site None! Watch out.
Modern/informative site.
Lists current companies
handled.
Candidate Selection Evaluate one candidate only.
Consider 3-5 candidates,
depending on complexity.
First Contact
Random solicitation by
unknown company.
Trade show or formal
phone meeting with
respected distributor.
Market Visit
Start partnership without
market visit.
Local assessment: office
meeting, warehouse inspection.
Store Check
No store check to validate
distributor capabilities.
Full day store check to measure
results for existing brands.
Reference Check
No financial
or commercial checks.
Check current principals plus
financial institutions (D & B).
Year I Plan No plan. “Buy and ReSell.”
Logical plan with targets,
activities, timelines, costs.
Price Calculation
Sell at dead net price.
Arbitrary mark-up.
Transparent price calculation
from factory to store shelf.
18
Retail buyers are challenged to maximize profits and sales from every available inch of shelf space. Every new item
accepted must improve on the performance of the brand currently occupying that space. Buyers are overwhelmed
by new product offerings, all with ambitious promises. Improve your chances of success by incorporating Export
Solutions’ 10 point check list on how to excite your category buyer about your new product.
How to Excite Buyers – New Product Checklist
Buyers: New Product Assessment
High Interest Low Interest
Category Opportunity Large or high growth Declining or niche
Brand Owner
Multinational or proven local.
Category expert
New foreign supplier
or start-up
Innovation
Something new, supported
by consumer research
“Me too” product
Profit Margin
Enhance current
category margin
Equal to or less than
current category margin
Sales Generates incremental sales Cannibalizes existing sales
Marketing Investment Sampling, social media, PR None
Trade Programs Invests in retailer “push” programs Periodic discounts/rebates
Brand Track Record Successful at other local retailers Unproven in the country
Terms/Conditions Attractive deal structure Typical terms/conditions
Representation Dependable local distributor Small, niche entrepreneur
19
Recipe: Best in Class Partnerships*
Ingredient Brand Owner Distributor
Results
Realistic expectations based upon
investment/market conditions.
Achieve sales increase in excess
of overall market growth.
Category Expertise
Share knowledge, trends,
and category analysis.
Serve as local category expert.
Educate the buyer.
Innovation
Constantly deliver important
new product ideas to market.
Successfully launch new products
into the market.
Investment
Appropriate Investment levels:
marketing/trade promotion.
Optimize return on investment.
Store Presence
Create clear, realistic guidelines
for in-store presence.
Share of shelf exceeds market
share. Maximize visibility.
Ideas
Support market driven ideas
to build the business.
Relentless pursuit of new and
better ways to grow sales.
Reporting
Concentrate on Basics: Listing
Map, Pricing, Merchandising Plan.
Complete reports accurately
and on time.
Focus
Periodic market visits and “rapid
response” to issues.
Appropriate level based upon
brand size and opportunity.
Cost to Serve
Remember that distributors need
to make money too!
Fair margin based upon brand
size and complexity.
Recognition
#1 Fan. Frequent recognition of
good results by all team members.
Strong commitment to exceed
expectations everyday.
*Mix Well for Best Results
20
Buyer Performance Appraisal
When is the last time you considered how your category buyer was evaluated? Buyers defintely maintain
a strict set of KPIs from their bosses. How is your new product pitch “Good for the Buyer?”
Buyer Assessment Criteria Objective
Category Sales Increase category sales at higher rate than retailer growth: 3-5%?
Category Sales per Square Foot
Increase category sales per square foot to higher level than
store average.
Category Profit
Increase category profits at higher rate than overall retailer
profit growth: 5-10%?
Category Profit Margin
Increase category margin to a level higher than total department
profit margin.
Category Share vs. Competitors
Higher share of total market category sales than retailer’s share
of overall market.
Service Level to Stores 98% minimum service level. Out of stock level: 1% or less.
Inventory Turns Exceed industry average of 18.5 turns per year.
Retail Prices
Maintain competitive retail prices, in line with chain’s
overall pricing position.
Private Label Sales
Increase private label percentage of category sales. Increase private
label sales at a higher level than overall category sales.
Listing Fee Funding
Achieve assigned budget for incremental supplier payments
including listing fees or equivalent.
Trade Promotion Funding
Increase total category margin dollars through back margin,
rebates etc.
Retailer Marketing Programs Supplier support behind retailer sponsored marketing programs.
Performance of Ad/Display Features Sales results of buyer allocated ad flier and display space.
Assortment and Innovation Offer variety versus duplication, while optimizing category sales.
Terms Improvement Improve terms and conditions: annual negotiations.
Cost of Goods: Price Increases Obtain best cost of goods. Fight price increases.
Industry Leadership Participate (or lead) external committees on industry development.
Supplier Relations Maintain positive relations with suppliers, particularly top 10.
Community Relations Build positive impressions for retailer through community support.
Category Expert
Understand trends, product attributes, performance,
and innovation for the category
20
2121
Export Reports: Format and Frequency
Every exporter requires certain reports to manage the business.
Productivity is enhanced when distributor focuses on selling activities versus compiling a stack of reports.
Everything functions better when reports are filed on a regular schedule.
Report
Description
Monthly
Quarterly
Annually
Distributor “Sell Out”
Distributor sales to customers
x
Sales Forecast
Rolling 90-180 days
x
Distributor Inventory
Weeks supply on hand, by sku
x
Sales Versus Budget
Progress vs. annual objective
x
KPI Dashboard
Coverage, Displays, Distribution, etc.
x
Listing Map/Plans
Brand/sku authorization,by customer
x
Sales Promotion Calendar
Capture adjustments, and payout
x
New Product Launch Status
Acceptance by key customer
x
Category Review (Nielsen ?)
Category trends
x
Retail Price Survey
Top 10 customers
x
Competitive Activty
New launches, innovation
x
Distributor Credentials
Distributor "standard" presentation
x
Credit Report
Financial update
x
Distributor Value Chain
Factory gate to store shelf
x
Annual Business Plan
Agreed road map to achieve objectives
x
Retailer Business Review
Top 5 retailers
x
List of Top 10 Customers
Plus your buyers name
x
Export Accelerator
Contact Us for Distributor Search Help in 96 Countries
Greg Seminara • greg@exportsolutions.com
“Spend time Selling to Distributors versus
Searching for Distributors”
22
Why have Barilla, Pringles, Nature Valley, Starbucks, Duracell,
Nestlé, Tabasco, Pepperidge Farm, and other leaders used
Export Solutions as a distributor search consultant?
• Powerful distributor network: owner of industry database
9,200 distributors – 96 countries
• Professional 10 step due diligence process
• Results! We make Export Managers’ lives easier!
Every job performance review measures results versus
shipment objectives. In the export world, shipments are the
key indicator of success, but can be manipulated by inventory
sitting idly in a distributors or customers warehouse. In
reality, the way to improve shipment results is to attack and
focus on causal factors that drive the business as well as other
metrics of success. Export Solutions has worked with several
of our consulting clients on developing scorecard metrics to
calibrate progress in the marketplace. Listed to the right are
metrics for measuring Export Success.
1. Market Share and Market Share growth
2. Per Capita Consumption of your product
3. Value/Volume Sales Trends (dollar/euro sales,
units sold/kilos sold, etc.)
4. Product Availability Grid Score – This measures authorized
items listed versus potential listings at most important
retailers in a market or territory. This score should be
weighted based upon a retailers share of market.
5. Promotional/Marketing Spending as a percent of Sales
Volume. Case rate spending levels
6. In Store Presence Grade/Trends – This is for brand owners
that employ a system of grading each individual store
7. Sales growth in excess of overall market growth. i.e. Market
is growing 5% and your brand grows 10%, so your brand
is growing at +5 points versus overall market growth
8. Share of Category assortment versus market share
Share of Category shelf space versus market share
Share of Category Displays versus market share
Share of Category Promotion Activity versus market share
9. Weighted Distribution, Trends – “# doors of availability,
by item”
10. Out of Stock levels and trends
11. Market Profitability – Margin, Total Value, Trends
12. New Product Launch Results– sales, weighted distribution,
market share
13. Days Outstanding/Trends, Bad Debt as a percent of sales.
Beyond Shipment Results – Measuring Export Success
23
Greg’s Guidance: Export Strategy 2025
3 What are your Lessons Learned?
3 What are your Core Competencies?
3 Which countries offer exceptional growth for your category?
3 How much is your company willing to invest? Marketing, People, Promotion
3 What will our organization need to do differently?
3 What are realistic measures and benchmarks?
24
Segmentation Factors
Segmentation analytics will vary by company. Absolute
population is just one factor warranting consideration. Other
criteria include size of the category, proximity to your producing
plant, as well as per capita spending power. For example, most
USA based exporters sell far more to Puerto Rico, an island with
3.1 million people, than they do to China or Brasil. As a result,
some USA brand owners place a strategic focus on the Caribbean
Basin countries adjacent to the USA and process only occasional
opportunistic shipments to complex countries such as China.
Mix of Countries
Most companies can dedicate focus on a strategic launch into
only one or two “strategic” countries at a time. It’s appropriate
to create a growth plan aimed at a mix of Strategic, Priority,
and Opportunistic countries.
Market Share Expectations
Your export road map should also be adjusted based upon your
market share expectations for a select market. Generally, there
are three scenarios for a brand to pursue.
Leader: Brand investment and innovation to become #1 in
the category.
Player: Brand plans to compete effectively, obtaining a market
share of 5% -20%.
Participant: Niche. Brand objective is incremental shipments
with little/no investment.
Lessons Learned
Calibrate expectations to investments in brand support and
management oversight. Everyone wants to be a category leader
or player. To achieve this lofty status, you need to conduct local
market research, innovate, maintain competitive pricing, invest
in marketing, and align with a strong sales team just as you do in
your home market. Projects fail as certain brands want category
leadership but invest only to “niche” levels.
Strategic segmentation of export opportunities is “Job One” for export managers. Export Solutions divides countries into three gr
oups:
Strategic, Priority, and Opportunistic. This approach filters countries by “size of the prize” and investments required to win. The basic
rationale is that a company should allocate different resources to develop a large country like Brasil, compared to a medium size
country like Belgium versus the Bahamas or Bermuda. Too frequently, we see companies handcuff all markets to one export program,
with common strategy, pricing, and investment models for all countries.
Country Segmentation – One Size Does Not Fit All
Country Segmentation
Country Profile Investment Required Business Model Examples
Strategic
(Focus)
Large Country
(pop. 50mm +)
High GDP
High Category BDI
Global Retailers
High Complexity
Significant Investment
in Brand support.
Market Research
Management Visibility
Local Office
or Distributor
or Joint Venture
Mexico
China
Brasil
United Kingdom
USA
Turkey
Priority
(Manage)
Mid size Country
(pop. 10 mm+)
High GDP
High Category BDI
Mid Complexity
Moderate investment
in brand support.
Managed by Export
Manager
Distributor
Chile
Australia
Canada
S. Korea/Thailand
South Africa
Spain
Saudi Arabia
Opportunistic
(Profit)
Profitable
Opportunities.
Low GDP Countries
Low Complexity
Minimal/no investment
in brand support
Distributor or
Direct to Retailer
Caribbean
Central America
Middle East
Africa

25
Successful export managers can be compared to roulette
experts. You need to spread your bets around many countries
in order to achieve your sales budget. Winning reflects luck in
the countries where you place big investments and avoiding
high risk regions. Export Solutions has recently completed
projects in 31 countries across 5 continents: China, Philippines,
Brasil, Mexico, UK, Myanmar, and of course, the USA. There’s
lots of potential new business if you know where to look.
The “loud” conclusion is that most brands should consider
an Asian pivot focusing on high growth countries with large
populations and expanding middle class. This includes priority
countries like China and southeast Asian Tigers like Indonesia,
but also Saudi Arabia and Gulf countries. The USA opportunity
is “Bigger than BRIC” for international brands. Favorable
exchange rates make this an excellent time for international
brands to invest in taking their USA business to the next level.
Country Segmentation Definitions
All countries are not created equal, with population and GDP
representing just starting points. Category development, retail
fragmentation, and cost of entry also signify key filters.
Historically, Export Solutions’ one page strategy grids have
segmented countries into three groups. First, Strategic countries
such as China, India, and Mexico that boast large populations and
require focused investments in marketing and human resources.
A second group of countries is identified as Priority countries.
Priority countries are mid-size, with populations between
10-50 million and require more modest levels of investment
and management oversight. Our third group can be considered
Opportunistic countries. These are small countries which can be
important profit generators with minimum resources deployed.
Crawl, Walk, Run, Wait, Halt
Export Solutions is adding five incremental segments to assess
market potential. Crawl, Walk, Run, Wait, and Halt refine our
market development recommendations based upon commercial
realities of the countries today. These comments reflect the
position the countries may be in the development curve
combined with current economic and retail dynamics.
Crawl
Crawl countries are markets where it’s time to get started! This
may include an initial market assessment and a small first order.
Crawl countries have an emerging retail structure supported by
a network of professional distributors. The objective in crawl
countries is to establish a brand presence, gain learning, and
secure some first mover advantage benefits before the “rest of
the crowd” arrives and listing fees escalate. Maintain modest
expectations, even in giant countries like India.
Walk
This signals a second phase in country development. It is likely
that your brand has already established a beach head and may
be experiencing impressive year on year results from a small
base. These countries warrant more attention and investment.
In the walk phase, you may change your partner from a small
distributor who is really a “buyer” to a more powerful partner
capable of building your brand at another level. Philippines,
Indonesia, Colombia, and Saudi Arabia are all excellent examples
of “Walk” countries.
Run
Now is the time for brands to invest in these high potential
countries. China and the USA (foreign brands) top the list
of strategic countries where your senior management must
commit to incremental resources. This includes local teams,
small factory (or copacker/jv), research, and marketing
investments. Evaluate your China and USA shipments and
validate that you are content with your current shipment
trajectory. More than likely, you will need to revise your
strategic plan to better access these benchmark countries.
The Gulf, Korea, and Panama are smaller countries that offer
exceptional growth opportunities.
Wait
I am a big believer in Brasil. However, the current recession
coupled with existing market complexities make Brasil a
country for only the most seasoned multinationals to
compete. Africa’s one billion citizens represent the last, great
untapped consumer market for most consumer brands.
Each month, I receive two types of calls on Africa. The first
requests help, as no one seems to have cracked the code.
The second type of call relates to another diversion problem
from Nigeria, Kenya, or Ghana. I never receive calls on any
success stories. South Africa is the exception, a “Crawl” or
“Walk” country for most.
Halt
Newspapers and financial indicators accurately identify these
countries. Some exporters with “poor eyesight” continue to
pursue these countries despite the obvious risks. This month,
I took a call from a mid-size Italian company, where the
export manager had lost his job over a $400,000 default from
a well known Russian distributor. I recently completed a
$20 million project for Argentina where the big issue was not
brand building capabilities but access to capital and ability
to clear foreign goods through customs. Most hope that the
fourth quarter election results in Argentina will break down
protectionist import barriers and resume normal trade with
one of my favorite countries.
Crawl, Walk, Run, Wait, Halt!
continued on next page
Crawl, Walk, Run, Wait, Halt!
300 Free Articles
Export Strategy
Distributor Management
26
Country Segmentation
(*actual country input will vary by brand)
Strategic
(Focus)
Priority
(Manage)
Opportunistic
(Profit)
Crawl
Brasil, India, Russia
Ukraine, Vietnam,
South Africa, Thailand
Myanmar, Cuba, Sri Lanka, Mongolia
Walk
Indonesia, Mexico
Philippines, Malaysia,
Saudi Arabia, Colombia
Guatemala, Bolivia, Ecuador
Run
USA, China South Korea, Taiwan, Peru Gulf, Israel, Panama, Costa Rica
Wait
Africa Argentina, Turkey, Iran Libya
Halt
Ukraine, Venezuela Yemen
What About Europe?
Most European producers find Europe
excruciatingly difficult, let alone the
possibility for premium foreign brands
to enter. Opportunities always exist in
Europe, particularly for innovative
brands or pursuing ethnic channels like
the market for “Made in the USA” or
Asian products. However the high cost
of entry in Europe coupled with declining
populations signals that you will likely
enjoy a higher ROI elsewhere. Proceed
cautiously and profitably!
Next Steps
The Crawl, Walk, Run, Wait, Halt
assessment model provides a framework
for all exporters. However, actual grid
output may will vary for each company
based on brand dynamics and existing
export footprint. For example, Mexico or
Philippines may be “Run” countries for
certain USA brands, but less important
for European companies. I would argue
that China and USA development focus
would be a long term “Gamechanger”
for most companies. Please excuse our
pessimism on “Wait” and “Halt”
countries, as it is our hope that these
important countries recover to create
new business in the future. Export
Solutions works in 96 countries, with
relevant field based, insights based upon
projects for many mid-large size USA and
European brands. Contact Greg Seminara
at [email protected] to
help you define your Export Strategy
Road Map.
continued from previous page
One Billion consumers reside in stable
markets of Europe and North America.
These established countries represent
14% of the world’s population, but
account for 70% of all retail sales
and 90% of the volume for most
supermarket brand producers. Growing
sales in our current selling universe
of one billion people is exceedingly
difficult. It requires true innovation
(which may be quickly copied) or costly
investments in marketing and trade
spending to steal share from your
competition. Most established markets
achieved 2021 GDP growth rates of
0-2%. Forward thinking brand owners
search for new growth regions to offset
mature categories in current markets.
Size of the Prize
Our industry is fortunate that all
7.9 billion of the worlds citizens require
food products. Current reach extends
to one billion consumers for most
companies. Two billion people live on
less than $2 per day, surviving on the
basics. This leaves manufacturers with a
potential untapped market of 4.2 billion
people that will eat more and better in
the future. This will create new demand
for our food, confectionery, household,
and personal care products. Emerging
Middle Class populations are
blossoming everywhere from the
legendary BRICS to previously
forgotten Sub-Saharan Africa countries.
New Holy Grail
A new Holy Grail of “selling to the next
one billion consumers” has been adopted
by industry leaders. The next billion
effectively doubles the size of the prize
for brands. Success with this lofty goal
requires marketers to teach consumers
new habits and practices or convert
consumers from local brands. This
represents a case of “Back to the Future”
for global brands. We must adjust our
sophisticated category management
approaches tailored for global retailers to
shift to the fundamentals of penetrating
fragmented markets. Plant managers will
wince at the request to shift production
from Costco sized packages to “pouches,
packets, and other pint sized portions”
required to gain trial and attractive
opening price points.
Rethinking Market Segmentation
Export Solutions segments markets into
three groups. “Established” markets
represent evolved markets such as the
Finding Our Next Billion Consumers
Total Population Potential Next Billion
China 1.45 billion 225 million
India 1.41 billion 200 million
Africa 1 billion 100 million
Latin America 600 million 150 million
South East Asia 600 million 100 million
Russia/East Europe 300 million 115 million
Middle East 300 million 75 million
Turkey/Central Asia 160 million 35 million
Total Population 5.71 billion 1 billion people
continued on next page
27
28
Country Segmentation 2022
Established Developing New Frontiers
Markets
Western Europe
USA/Canada
Japan/Australia
Central/East Europe
Latin America
(ex Brazil)
Saudi Arabia/Gulf
China/Korea/Taiwan
Africa
Brazil
India/Turkey
Balance Middle East
Balance Asia
Population 1 billion 2.2 billion 4.7 billion
Share Global Population 13% 28% 59%
Share Global Retail Sales 70% 20% 10%
2022 GDP Growth 0-3% 3-7% 3-7%
Finding Our Next Billion Consumers
USA, Western Europe, Canada, and
Australia. “Developing” markets
indicate markets such as China, Russia
and Mexico where many companies do
business, but per capita consumption
levels are low. ”New Frontiers” reflect
countries (Africa) with no existing
sales for a brand, or tiny businesses
relative to the size of the population.
(India/Brazil).
High Potential Regions
China leads the list due to a reported
middle class of 175 million people.
India’s middle class of 150 million
is expected to double in the next
five years. Latin America also looks
promising due to strengthening
economies in Brazil & Mexico plus
proximity to the USA. Population
explosion in Southeast Asia could
allow Indonesia to reach 300 million
people and the Philippines and
Vietnam to each surpass the 100
million population threshold. Middle
East and Russia will remain attractive,
as long as the price of oil is $80 per
barrel or higher.
Follow the Global Retailers
Brand owners can quickly identify
priority countries by following the lead of
global retailers. Leaders such as Walmart,
Carrefour, Metro, and Tesco spend
millions analyzing market potential. Look
at China, where every global retailer has
battled for the last 10 years. Retailers are
all planting small flags in India, quietly
creating infrastructure and “wholesale
based” presence in advance of the
eventual opening to foreign supermarket
operators. Walmart’s blockbuster
purchase of Massmart in South Africa
represents a transformational event in
the history of our industry in Africa.
Walmart’s exceptional results in Mexico
and Brazil offset stagnant performance
from their USA business. Global retailer
presence is smaller in Southeast Asia, the
Middle East, and Russia. However, my
bet is that the giants are watching local
supermarket chains sweat to build critical
mass before sweeping in to acquire once
the initial footprint has been created.
Distributors – Local Experts
Most manufacturers prefer to partner
with a distributor versus creating a local
subsidiary in “New Frontier” markets.
This allows brands to test their way into
a market and focus investments on
brand building versus infrastructure.
Companies instantly benefit from the
distributors long standing relationships
with local supermarket buyers and can
gain valuable “lessons learned” from
the distributor’s other brands. Seek
distributors with experience pioneering
other premium, international brands.
Export Solutions’ distributor database
covers 96 countries, tracking more than
100 distributors each in China, Brazil,
Russia, Mexico and 90 in India.
Next Steps: Management Commitment
Selling to the next billion consumers
requires familiar strategies and tactics.
Brands tap into their learning base of
best practices across the globe. Most
companies know how to gain product
trial in emerging markets and how to
penetrate countries dominated by small
shops. The key is to secure senior
management commitment to the vision
of selling to one billion new consumers.
The real investment is in people required
to execute the plan. Export Solutions
can help!
continued from previous page
29
When was the last time you reviewed your distributor contracts?
Fortunately, both brand owners and distributors only dedicate
time to these documents at the start of a relationship or when the
end is near. View our ten tips on handling distributor contracts.
1. Contract, Letter, or Handshake deal?
Most companies maintain a mix of these type of relationships.
This is normal, although most wish to standardize the model.
The rule of thumb is that the “more money you spend, the more
detailed the contract you need.” A simple two page letter of
understanding may be appropriate for a small business or a
handshake commitment in situations where the distributor
“buys and resells.” However, fully supported brand launches
and business management of a global brand usually requires
a detailed contract to protect both parties.
2. Sole Versus Exclusive Distributor
Most distributors demand country exclusivity. This is standard,
but may cause problems if the region is subject to inbound
shipments from global customers, e-commerce, or grey market
traders. A compromise is to offer a contract as the “sole”
distributor, providing protection from the manufacturer
appointing multiple partners in a country.
3. Distributors are Customers
At contract time, some manufacturers fail to remember that
distributors are customers, buying your product and reselling
to all local retailers. Suppliers may forward “one way” contracts
that are biased to terms favoring the manufacturer. Would you
send a contract like that to Kroger, Carrefour, or Tesco? Key is
to strike a reasonable balance favoring commercial sensibilities.
4. E-Commerce Implications
Many distributor contracts were executed before the advent
of e-commerce. Revised agreements may be necessary
incorporating e-commerce service requirements: items,
pricing, inventory, metrics, channel exclusivity.
5. Local Law Dominates
Overseas companies should have their contract reviewed by a
local law firm to guarantee compliance with local regulations.
For example, in Puerto Rico and Belgium, distributor (agent)
protection laws supercede any contract language.
6. Point of Arbitration
Normally, the brand owner automatically assigns his home
country as a point of arbitration for any disputes. In some cases,
both parties select a neutral country like Switzerland. A global
corporate counsel once taught me that ultimately any dispute
will need to be resolved in the distributor’s home country. For
example, a USA company can sue a distributor in a USA court.
It is unlikely that the distributor will hire a USA lawyer or even
show up. The USA court may enter a judgement, but the brand
owner still needs to go to the distributor’s country for enforcement.
7. Notification of Contract Termination
Standard contracts appear for two or three years with provisions
for automatic renewal. Distributors fight for long lead times; a
loss of brand can represent a major disruption. From a brand
owner’s side, would you want a terminated employee working
for you for six months or one year? I prefer three months
notification, but that can also backfire if the distributor resigns
your business.
8. Loss of Major Principal
Sadly, I have witnessed distributor bankruptcies because they
were doing “too well.” A distributor grows the brand to a size
where the manufacturer decides to take the brand back and form
a subsidiary. The distributor scrambles, but sometimes they need
to lay off more people and causes a rapid exit of other brands.
2022 contracts should require distributors to inform you within
10 days of notification (not effective date) of any loss of principal
representing ten percent or more of their business.
9. Global/Regional Customers
Large players like Walmart, Costco, Amazon, and Carrefour can
be difficult to manage. They demand best pricing system wide or
threaten to trans ship from other locations. In some cases, these
retailers may demand to “buy direct.” In this case, you can add
an “indent” clause permitting this practice while compensating
the distributor for local services such as merchandising.
10. Late Payments & Currency Exchange Rate
A distributor that pays late signals financial difficulties. Include
a clause that allows you the option to consider the contract in
default with payment delays beyond 45 days or with frequent
problem payers. The benchmark for calculating currency
exchange rates should be specified in the contract. I have seen
cases where a distributor assigns a five to ten percent benefit in
his favor to protect against the possibility of currency swings.
10 Tips: Distributor Contracts 2022
Need more information? Visit www.exportsolutions.com.
30
Don’t Tell Your Boss!
“Spend time Selling to Distributors
versus Searching for Distributors”
www.exportsolutions.com
Finding qualified new distributors is tough! Export Solutions makes life a little
easier with our time saving distributor database.
• Coverage: 96 Countries. 9,200+ distributors of food, beverage, and snack
products. Includes 2,713 snack and 3,276 international food distributors.
• New: 1,397 worldwide distributors specializing in Italian Food products.
• Annual subscription to the database costs less than the price of one business trip.
• 3,000 brand owners and government trade organizations use Export Solutions’
database to “fill in the gaps” in their export coverage map.
31
Criteria
Rating Evaluation Factors
Shipment Results
Overall growth for our industry in your market?
Distributor company wide sales performance
(all brands)?
Distributor sales results for my brand?
Change vs. benchmarks?
Brand Performance
Key brand performance versus overall category.
Shipment growth, market share, weighted distribution.
New item success.
Key Account Results
Results at top 3-5 accounts (or channels).
Improvements: new items, shelf presence,
merchandising.
Are we getting “fair share” of retailers growth?
What Worked?
Strategies or performance that achieved results.
Ideas that delivered incremental sales.
Key Issues?
Problems or barriers to achieving results.
Pricing, investment, competition.
People
Performance by key people touching our business.
Organizational changes? Who made a difference?
Financial
Distributor’s financial health. Planned investments.
Efficiency opportunities in Partnership.
2022 Requirements
Resources required to achieve 2022 shipment expectations.
Critical activities, timelines, changes to structure/plan.
Distributor Market Review
Greg’s Ten Tips
1. Good news travels fast and bad news
travels slowly
2. If you want to know what’s really going
on, spend a day visiting stores
3. Pick up the phone and call a friend or business
partner versus email
4. Be positive. Think, “why not?”
5. Results are directly proportionate to your
investment: Marketing, People, Focus, Time
6. A distributor (or Broker) “respects” what
the Brand owner “inspects”
7. Shipment numbers rarely lie
8. Put it in writing
9. If two people agree on the principle of a deal,
you can usually work out the financial terms
10. There is more in common with industry
practices across the globe than differences.
Brand owners everywhere desire more shelf
presence and retailers demand more discounts.
Recognize the differences, but focus on the
universal requirement for superior products,
marketed at a fair price.
32
Distributor Performance: 20/20 Business Analysis
The start of a new year is an appropriate time to review distributor performance. This process starts with the evaluation
of the usual metrics such as shipment results, market share, and success delivering new item placement. Normally, distributor
performance ranges across the spectrum from outstanding results delivered by top distributors to under-achievers who fail to meet
their shipment budget. Each scenario warrants a different approach in terms of managing for the future.
Distributor Segmentation Analysis
A valuable exercise is to segment your existing distributors into
the three groups: Leaders, Performers, and Laggards. Look at
the organizational models of your “Leaders” and Laggards”.
Are there consistent threads between the business specialization
of your distributor network? For example, do you find that your
“Leaders” are all Large Distributors (versus small), Big Brand
Distributors (vs. niche), Category/Ethnic specialists (vs. all types
of Food), technologically savvy versus “old school”? A similar
analysis should cover your “Laggard” distributors. Are under
performers small organizations that fail to meet your
requirements? Or alternatively, large distributors where your
brand is too small to gain sufficient attention? Your analysis may
reveal that one type of model works well for large or adjacent
countries while another approach works best for smaller or
remote countries. Look for the trends!
Lessons Learned
Completing the distributor segmentation exercise described
above should yield some important conclusions on the best
partner models to pursue for your brand. For example, an Italian
manufacturer of candy may confirm that his best performing
distributors are international confectionery experts, versus
distributors specializing only in Italian products. On the other
hand, an ethnic Asian food producer may find that the best
candidates to represent his brand are Asian channel specialists
versus distributors that represent all types of fine food categories
such as Tea & Olive Oil.
Next Steps
Honor your leaders and drive them to higher levels. Recognition
such as Distributor of the Year, visits with your company CEO,
or requests to deliver a presentation on their “success story” are
inexpensive motivators. “Laggards” impact our own ability to
achieve our personal objectives. We often like the people who work
at “Laggards”, but at times, you must act to protect the long term
interests of your company and pursue a change in distributors.
It is important to recognize that all companies have distributors
that are “Leaders” and “Laggards”. Proactive attention to fix the
“Laggards” will only improve your results versus suffering
through another year with a poor performing partner.
Export Solutions Can Help
Our industry leading database has been used by more than
3,000 brands to locate partners in 96 countries. This includes an
average of 85 unique distributors per country. There are always
many alternatives to consider in every country when you have
access to the Export Solutions database.
Export Solutions serves as a consultant to European and
American brands of all sizes. Our work includes analysis
of distributor networks and development of strategies for
motivating, measuring, and rewarding distributors. Export
Solutions has helped companies identify, interview, and sign
distributors on every continent. Contact Greg Seminara at
[email protected] to discuss your project.
Our motto is “Spend time Selling to Distributors vs. Searching
for Distributors”.
Distributor Segmentation
Results Next Steps
Leaders
20% of total
Shipment increase of 10% or more.
Growing Market Share.
Innovative Strategies.
Recognition: Public & Financial.
Invest in team generated ideas.
Share learning with other markets.
Performers
60% of total
Shipments + 5% and in-line with
overall market growth.
Consistent results over
many years.
Support current growth trajectory.
Challenge to reach “Leader” status.
Laggards
20% of total
Flat/declining shipments.
Poor results for 2+ years.
Low energy/innovation.
Probation status for existing partner.
Evaluate different representation options.
All markets have alternatives!

33
A Gentle Approach
Changing distributors is never easy, because we usually like the people involved. Best approach is
to accept part of the blame for the failed relationship. Provide the old distributor a believable sound
byte that he can repeat to maintain dignity in the marketplace: i.e. brand owner was looking for a
distributor with more foodservice or small shop coverage. In the case of a long term partner (5 years or
more), it may be appropriate to offer a lump sum goodwill payment, payable 90 days after transition
in return for their cooperation. The good news is that a new distributor will emerge as motivated
partner, anxious to take a “fresh look at old challenges” and deliver on their commitment to you.
Every company includes distributors
that appear as chronic under-performers.
Year after year, management listens to
excuses and we patiently “give them
a little bit more time.” 2021 results are
in and it’s easy to spot the problems:
big country, small shipments. The new
year is the right time to implement a
process of upgrading your distributor
network to a partner more aligned with
your business goals. Listed below are
key action steps.
New Year’s Resolution -–
Preparing for a Distributor Change
3 Secure agreement from management to change distributors
3 Review your original distributor contract
3 Send official letter to distributor recapping disappointing results
3 Obtain current distributor price calculation
3 Document and monitor inventory in the system, by SKU
3 Watch account receivables and bill-backs
3 Confirm in writing 2022 spending and promotion plan
3 Interview and pre-select an alternate distributor
3 Establish realistic transition timeline with new distributor
3 Advise old distributor of change in person
34
1. Determine Brand Ambition for Country
Will your brand be a category leader, player,
or niche participant?
2. Establish Distributor Selection Criteria
Big brand distributor, category specialist,
or smaller entrepreneur?
3. Create a Pool of Candidates
Export Solutions’ database tracks
9,200 distributors in 96 countries.
4. Determine Candidate’s Preliminary
Interest Level
Send introductory email, followed
by phone call within 48 hours.
5. Organize Introductory Web Interview
Key Facts: Sales turnover, # employees,
companies handled.
6. Schedule Distributor Interview
in Candidate’s Office
4-6 weeks lead time. 2 hour meetings.
Send advance agenda.
7. Independent Store Checks
Provides category insights and real distributor
performance for current brands handled.
8. Interview Preparation: Scorecard, Samples,
Your Presentation, Key Questions
Export Solutions’ templates: Assessment
Scorecard & Ten Questions for Every Interview
9. Distributor Interviews – Target 3 Candidates
Review capabilities, warehouse and interest
in your brand.
10. Cooperation Model
What is the plan? Year one plan, pricing
calculation, and timeline.
10 Step Distributor Search Process
Looking for Good Distributors?
Export Solutions’ database covers
9,200 distributors in 96 countries.
www.exportsolutions.com
35
Big Brand Distributors
Large distributors supply an economical
alternative for leading brand manu-
facturers versus operating their own
subsidiary. Normally, they handle
multiple categories and offer critical
mass. A potential issue is the struggle
for attention among brands all vying
for focus from one sales team.
Category Expert
Buyers value partners that serve as
category experts who can share insights
and innovation for the sector. Distributors
dedicated to one sector provide logistics
efficiencies and capability to share best
practices from complimentary products.
Managing product conflicts is a frequent
problem with distributors concentrated
on only one category.
Channel Expert
Many distributors built their business
platform centered on servicing the
supermarket channel. Incremental growth
today is dependent on penetrating under-
served channels such as foodservice,
small shops, or pharmacy. In larger
countries, it’s possible to maintain one
organizational approach for supermarkets
and then appoint a specialist for a
different channel. Alternate channels
normally feature smaller store footprints
which can provide a barrier to entry for
all but the leading brands.
Country Expert
Some distributors have created viable
businesses as the source for brands from
one country. These distributors supply
brands to consumers “homesick” for
their favorite brands at a premium
price. A benefit with this option is
the distributor who can consolidate
shipments from one country and
is connected with the retailers and
consumers for this “expat” segment. This
approach works well for niche products
or brands focused on availability without
marketing investment.
Fine Food Importer
Food enthusiasts everywhere are
passionate about the gourmet experience.
Fine dining restaurants are dependent on
unique products and ingredients from
around the world. The classic fine food
importer fulfills this role. Fine Food
importers seek brands of the highest
quality, with unique attributes and
reputation. Not an option for
commodities or “me-too” type products.
Niche Entrepreneur
Pioneering a brand with no existing
sales is tough in any country. While many
brands would prefer partnering with a
prestigious specialist, the reality is that
a smaller distributor may be your best
option to start. Niche entrepreneurs are
hungry and flexible to work without
significant resources supplied by the
brand. It is important to calibrate your
expectations when working with a niche
entrepreneur and conduct due diligence
on their financial situation.
Evaluate Your Current Distributor Mix
A valuable exercise is to evaluate your
current roster of distributors “by type”.
Which models are delivering superior
results? Which models are lagging
behind? Are there any universal
conclusions which may apply when you
expand to new markets or considering a
distributor change? One type does not fit
all scenarios. However, it is important to
segment your partners and understand
the inherent strengths and issues with
different types of distributor partners.
All distributors are not created equally! Most exporters recognize obvious differences based upon the size of distributor and breadth
of service offering. Export Solutions has identified six common types of distributor business models. Global brands maintain a mix
of distributor relationships. Some partnerships are new while others have evolved for thirty years or more. With time, requirements
for servicing our industry have changed. While some distributors have remained generalists, handling many brands and channels.
Others elected to focus against a specific market segment. Which model delivers the best result for your brand?
Distributor Types: Different Experts for Different Situations
Distributor Types: Different Experts for Different Situations
Distributor Type Model Application
Big Brand Distributor
Large Distributors.
Handles # 1 or # 2 brands.
Multiple categories/channels.
Outsourcing solution. Option for
Latin America, Middle East, Asia,
Europe (excluding large countries)
Category Expert Dedicated to one category
Specialists for Confectionery, Frozen, OTC,
Beverages, Natural Foods, Dairy, Beauty
Channel Expert Dedicated to one channel
Specialists for Foodservice, “small shops,”
or Pharmacy channels
Country Expert
Represents brands exclusively
from one country/region
Specialist for Brands from USA, UK, Germany,
Asia, Italy, or Spain
Fine Food Importer
Represents leading international
gourmet/niche brands.
Handles brands like Tabasco, Maille, Bonne
Maman, Twinings, Bahlsen, Ryvita
Niche Entrepreneur
Small distributor.
Willing to pioneer new brands
with limited marketing support
Option for small brands or countries where
brand does not want to invest.
36
Distributor Selection Road Map
Export Solutions Performs Distributor Search in 96 Countries
Most companies maintain diverse distributor networks: A mix of large and small distributors, category
specialists, and those focusing on brands from your home country. Export Solutions recommends performing
a distributor model analysis of your current distributors to determine which type of distributor is delivering
“Best in Class” results. An important consideration is your brand ambition and investment level for a country
when evaluating distributor performance. The results of your distributor model assessment can be used to
guide new distributor selection or upgrade your current distributor network. Export Solutions can help!
Brand Ambition
Country Importance Strategic Priority Opportunistic
Brand Market Share
Objective
Leader Player Niche
Brand Investment Model Mass Marketing 10% of Sales Dead Net Price
Distributor Selection Criteria
Preferred
Distributor Size
Large Medium Small
Channel Specialization Supermarkets Foodservice Pharmacy
Category Specialization All Food
Confectionery
& Snack
Beverage
Gourmet Natural Food Health & Beauty
Ethnic Food Frozen/Chilled Household/Non Food
Country Specialization USA France Germany
Italy Spain United Kingdom
Asia Latin America Middle East
Benchmark Brands
(examples)
Pringles Barilla Tabasco

Export Passport
Strategic Export
Development Program
37
Strategic Export
Development Program
Export Passport
Export Passport

38
Distributor Search Challenge
• Some distributors are too big…
• Other distributors are too small!
3
Export Passport identifies
Prime Prospect distributors
that represent the Right Fit
39
Exporter Classification*
Type Description
Export Profile
10 Multinational Strong market share everywhere across multiple categories.
9 Global Multinational. Mix of leading countries and niche participation.
8 Category Champion One core mass category. Strong performance globally.
7 Icon Well known, niche leader. Global availability. Example: Tabasco.
6 Regional Leader Strong share across one continent/region. Some export success.
5 National Hero National treasure, #1 brand. Exports to homesick expats, tourists.
4 Player Respectable share in home country. Opportunistic exports.
3 Participant “Me too” product. Opportunistic exports. “Trader”/private label.
2 Challenger Innovator. Some listings in home country. New to export.
1 Start-up Trying to get traction in home country. Export “dreamer.”
*Export Solutions’ classification system
40
Distributor Classification*
Stars Title Description Prime Prospects
HHHHH
Champion
Massive distributor.
Handles multinational/#1
brands across many
categories.
Brand leaders.
$$$ marketing budgets.
Exporter types: 6-10
HHHH
Captain
Category Captain.
Handles leading brands in
one segment.
Category
innovators/leaders.
$$ marketing budgets.
Exporter types: 5-9
HHH
Player
Mid-size distributor.
Handles #2/3 brands or
niche leaders across many
categories.
Differentiated,
premium brands.
$-$$ marketing budgets.
Exporter types: 4-7
HH
Participant
Respected local.
Diversified product
portfolio.
Results equal to investment.
Flexible, challenger brands.
$ marketing budget.
Exporter types: 2-4
H
Pioneer
Small distributor.
Entrepreneurial, open to
innovative new companies.
Start-up brands.
“Pay as you go” marketing.
Exporter types: 1-3
Need more information? Visit www.exportsolutions.com.
*Export Solutions’ classification system
4141
We’ve Got You Covered!
Distributor Database Coverage
Confectionery & Snack:
2,713 Distributors
Ambient Beverage:
1,691 Distributors
Gourmet & Ethnic Foods
3,276 Distributors
Asia
2,030 Distributors
17 Countries
Middle East
937 Distributors
12 Countries
USA Importer/Distributor
:
598 Distributors
Latin America
1,574 Distributors
Europe
3,139 Distributors
9,200 distributors – 96 Countries
Subscribe now at www.exportsolutions.com
“Spend time Selling to Distributors versus Searching for Distributors”
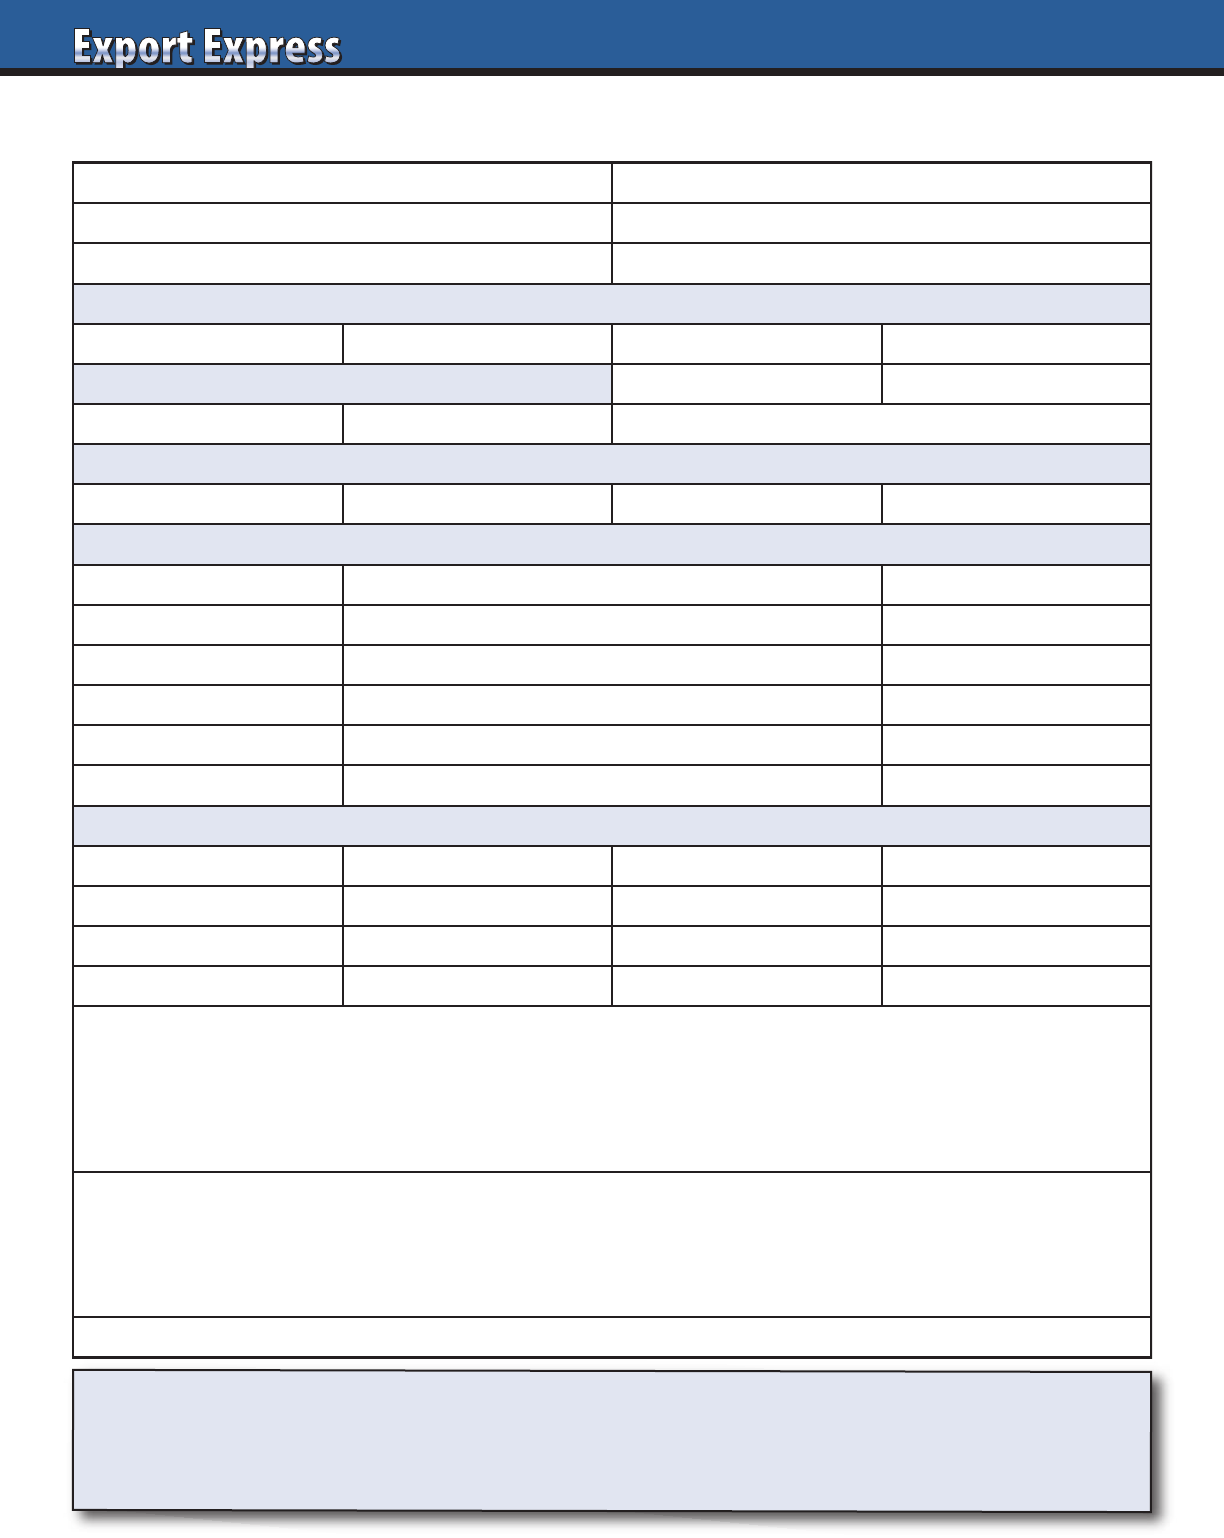
4242
Export Solutions recommends creating your own one page Export Distributor fact sheet template. Insist that all candidates
complete the template 100 percent prior to a phone interview or trade show meeting. Pay particular attention to the annual
sales number, brands represented and manufacturer references. Qualified candidates will enthusiastically complete these
sections. “Pretenders” or time wasters will leave these sections blank or disappear saving you time and money!
Export Distributor Data Sheet:___________________________________
Key Contact: Telephone:
Web Site: Email:
Annual Sales: Total Employees:
Employees, by Function:
Key Account Sales Logistics Marketing Merchandising
Company Owned Warehouse: Yes No
If Yes Warehouse Size: Location:
Channel Coverage (percent sales by channel):
Supermarket Convenience Foodservice Other
Top Five Manufacturer Clients:
Company Name Brands Represented Years Service
1
2
3
4
5
Manufacturer references:
Company Name Contact Name Contact Telephone Contact Email
1
2
3
Why are you interested in distributing our brand?
Why is your company the best candidate to represent our brand in the market?
Feel free to attach your company credentials presentation.
(Distributor Name)
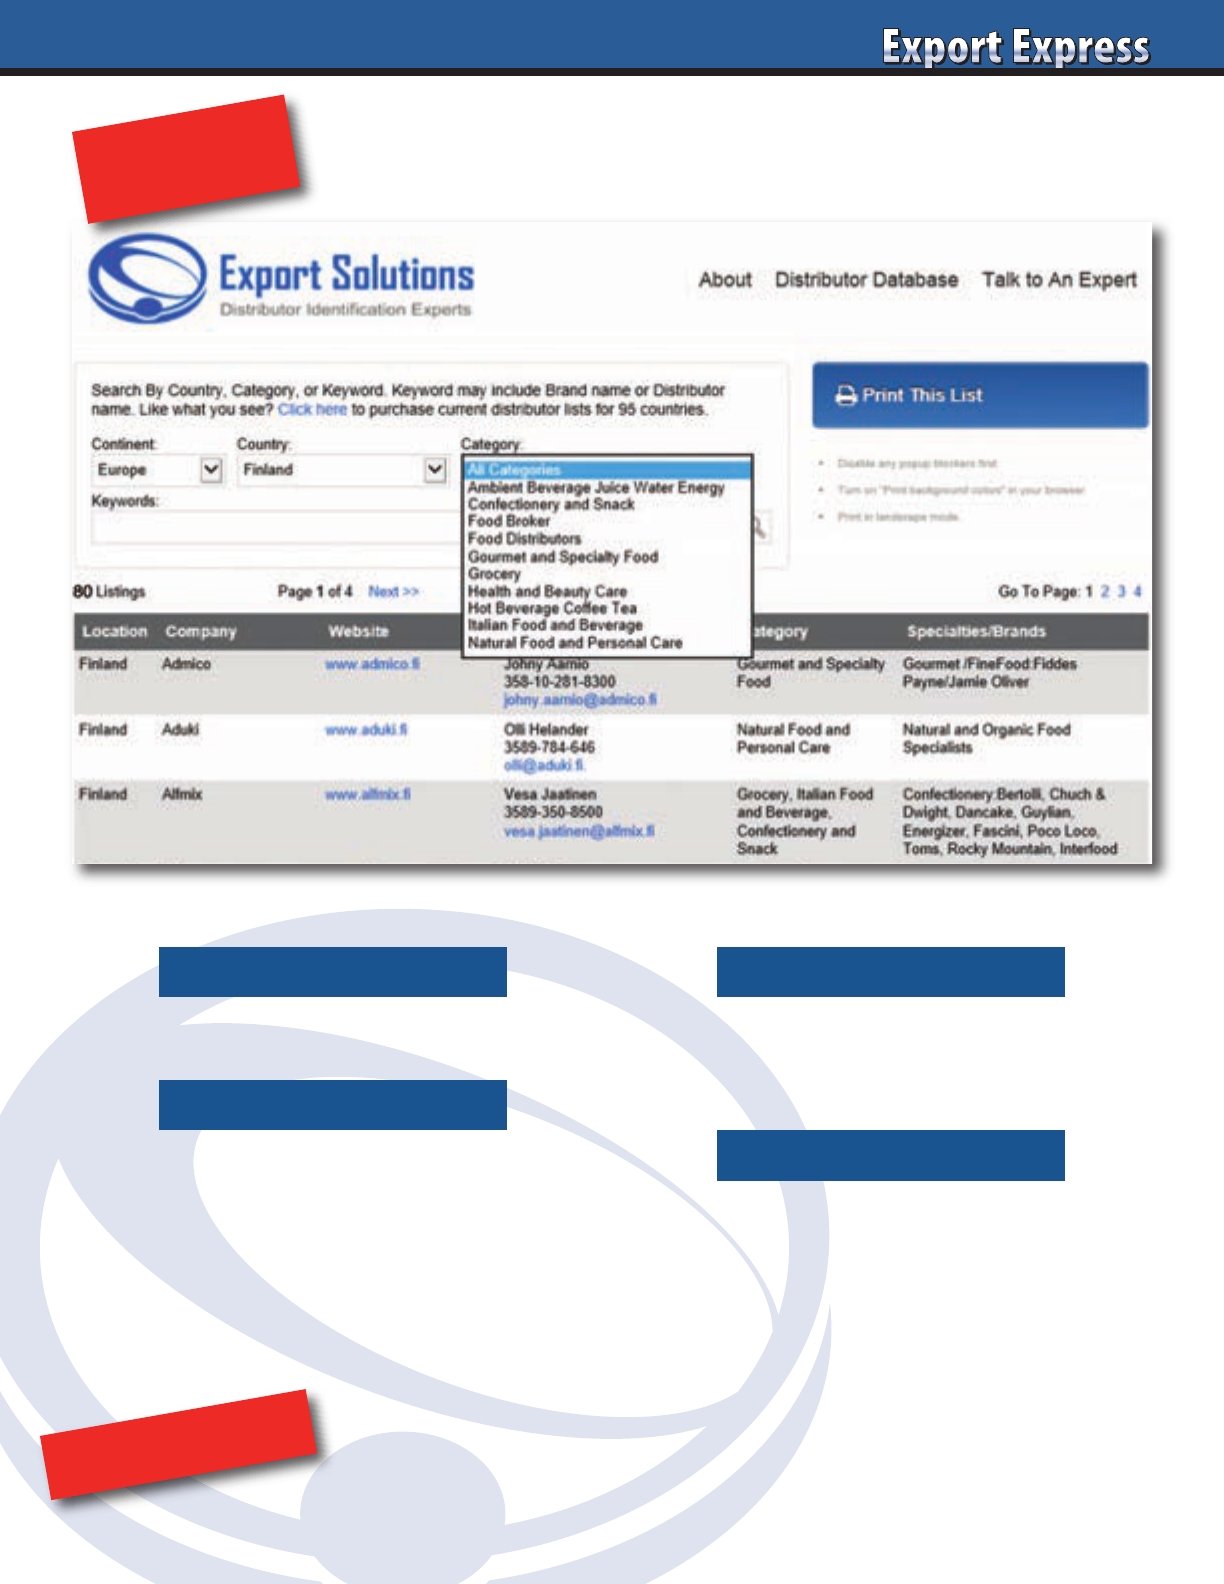
43
Coverage: 96 countries and 9,200 distributors
Confectionery & Snack
Gourmet/Ethnic Foods
Beverage (Ambient & Hot)
USA, German, UK, Italian Food
Health & Beauty
Tracking Distributors for more than 300
of the world’s most famous brands.
Example 1: Who are Beverage Distributors
in Germany?
Example 2: Who is the Pringles Distributor
in Saudi Arabia?
NEW!
ORDER NOW!
Distributor Search Made Simple
43
Search by Brand NameSearch by Country
Search By Category
Combo Search
www.exportsolutions.com

44
Every export manger has performed the
time consuming function of reaching out
to potential distributor candidates in a
new country. The process is usually
successful, but requires patience and
perseverance. Top distributors are
overwhelmed with new representation
inquiries. These requests must compete
for attention with the hundreds of emails
in the distributors inbox from his existing
brands. Export Solutions has worked on
more than 300 distributor search projects
across 96 countries. Below are our Best
Practices for contacting new distributors.
Email Plus Phone Call
Email candidates a short, fact based, note.
You may receive an immediate response
from a few hungry and motivated
candidates. More likely scenario is the
need for an immediate phone follow-up.
Work with the contact’s assistant to
schedule a phone meeting or ask to speak
with the person in charge of “important
new business” projects. Periodically, I
will also contact a distributor through
LinkedIn, as that often routes through a
different email address. Lack of response
after several attempts means that the
distributor is not interested. On the other
hand, you must persevere as frequently
the boss may be busy or not glued to
email like the rest of us.
Avoid Mass Mailing
Distributors recognize an email blast from
miles away, guaranteeing a low response
rate. Better to send a personal email,
mentioning the contact’s name, how you
found him and your rationale for contact.
i.e. “we are looking for a partner with a
strong track record building other USA
brands.” Target distributors which may
be a good fit based upon your investment
level and brand ambitions. For example,
large power distributors prefer brands
with strong marketing plans, while
smaller distributors appear more open
to pioneering promising new products
without giant spending budgets.
Company Credentials Information
Do not bombard a candidate with
attachments and PDFs of lovely brochures
prepared by an ad agency. First, many
people automatically delete emails
with attachments from people they
don’t know. Send PowerPoints and
project details only after you have
established contact.
What Distributors Want to Know
Distributors want to know who you
are: what is the size of your company,
brand USP (why are you different?)
international success, and plans
(investment strategy) for their market.
Distributors’ mindset is to quickly
calculate how much money they can
make representing your brand and how
tough will it be to sell to their customers!
Market Visit
Distributor response will be improved if
you request an introductory meeting at
their office. This demonstrates that you
are serious about the project and
interested in brand building, not just
selling a few containers. Try to visit at
least three distributors on your trip, more
if it is a large country or you anticipate a
“tough sell.” Schedule your visit at least
6-8 weeks in advance to guarantee
distributor availability.
Distributor Search Guide – Export Solutions
Export Solutions’ web site contains a free
Distributor Search Guide. This guide is
jammed with strategies, ideas, and
templates to guide each step of the
distributor search process. Export
Solutions completes distributor search
projects for leading brands worldwide.
Contacting New Distributor Candidates – Best Practices
Sample Introductory Email
Subject: New Business Opportunity – CerealCo* – USA
Dear Alexander:
CerealCo is a popular cereal brand from the USA.
Founded in 1960, 2022 sales will exceed $300 million
dollars. Our point of difference is that CerealCo offers
high quality gluten-free and organic cereals popular
with many modern consumers. CerealCo exports to
25 countries, including several in Asia.
We are now beginning the process of considering
partners for Indonesia. I understand that you have a
successful track record building other well known USA
grocery brands. Can we arrange an introductory phone
meeting for Wednesday at 900 am? I am based in
Atlanta, Georgia, -12 hours versus Jakarta.
For more information, visit our web site at
www.cerealco.com
Kind regards,
Greg Seminara
Export Manager
(001)-404-255-8387
*Note: CerealCo is a fictitious company. Any resemblance to an
actual cereal company is coincidental.
4545
Annual Sales:
$300 million US dollars in 2022
History:
CerealCo founded in 1960…62 years old
Core Product Portfolio:
Breakfast Cereals – “Leader in Organic/Gluten-Free Cereals”
Web Site:
www.cerealco.com
International Overview:
Direct sales to 25+ countries. Indirect sales to 50+ countries.
2021 International sales + 25%!
Southeast Asia Status:
CerealCo products available across Asia through a hybrid model
of partnerships, distributors and indirect sales through USA
consolidators. Current net sales of roughly $2 million dollars
in Asia Pacific.
CerealCo Objective:
Align with a distributor with strong brand building capabilities.
Develop a collaborative plan to grow business to comparable
levels to of our successful business in other Asia Pacific countries.
August Market Visit
CerealCo will visit Jakarta the week of August 1.
We will visit stores and meet potential partners to discuss
CerealCo plans.
*Note: CerealCo is a fictitious company. Any resemblance to an actual
cereal company is coincidental.
Company Fact Sheet (add your logo)
CerealCo* Summary – Indonesia Example
Best Practices – Contacting New Distributors
Do Don’t
Email Content
Short introductory email.
Company facts plus web link.
Lengthy email with
generic claims on
“why your brand is the best”
Email Delivery
Send on Monday.
Distributor has week to review
Send on Friday.
Email lost over the weekend.
Email Timing
Should arrive to distributor
at 2:00 pm his time.
After the “morning rush”.
8:00 am/9:00 am emails are
reviewed quickly and deleted
Phone Contact
Start calling 24 hours
after initial email.
Wait a week to call.
Attachments
No attachments on first email.
Web link only.
Send PowerPoints or
pricing on first email
Follow-Up
Constantly, if you believe
it’s a good candidate.
Wait for distributor to
contact you
In Country Meeting
Best opportunity to review
your brand proposition.
Create relationship without
market visit.

46
Agenda: New Distributor Interview
1. Distributor Capability
History, organizational model, coverage,
Companies represented.
2. Category Insights
Distributor observations and analysis
of your category? Category sales data?
Store check photos?
Gaps? Recommendations?
3. Success Story
Request example using a brand of similar
size to your brand. Success story could be
“Pioneering a New Brand” or “Taking an
Existing Brand” to a higher level of sales.
4. Distributor Cost to Serve
General model of financial cost to serve
the market. Retailer costs for listing fees,
trade promotion plus everyday category
margin. Distributor margin estimate and
services included in margin.
5. Warehouse Visit
Check companies represented and
inventory, by brand, for accurate view.
6. Year 1 Action Plan
If distributor hired, what would be their
Year 1 action plan?
Note: More relevant for existing brand
looking to grow.
7. Brand Owners:
Company Credentials Presentation
Company History, product portfolio,
point of difference.
Share product samples.
8. Brand Owners:
Status/Plans for Country
Brand Ambition for the country.
Current distribution levels and pricing.
Planned investment level.
9. Next Steps
Determine mutual interest level.
Establish timeline, point person
for distributor and brand owner.
Prepare category review, year I plan,
and price calculation model.
Looking for Good Distributors?
Export Solutions’ database covers
9,200 distributors in 96 countries.
www.exportsolutions.com
47
10 Questions for Every Distributor Interview
1.Company History
How long have you been in business? Who are the owners?
How many direct, “payrolled” employees do you have?
Approximate annual sales volume?
2. Company Brand Portfolio
What are your top 10 companies/brands represented?
For which channels do you represent each brand?
How long have you represented each brand?
Can you provide senior level references at each “brand owner”?
3. Key Account Buyers
Who is the buyer for our category at the largest retailers
in your market? What other brands do you sell to our buyer?
How frequently do you visit each major customer?
4. New Product Launch Success Story
Provide a recent example of a new brand launch success story.
Key retailer acceptance? Cost of entry? How long did it take?
Key elements of the success strategy?
5. Creative Selling
Provide an example where you took an assigned
marketing/brand support budget and created a successful
local program. How do you measure success?
6. Retail Servicing
How many full time employees do you have visiting retail
stores? Are they located countrywide or just in the capital city?
How do you measure a “good store” in terms of brand presence
versus a “bad store”? Describe your retail reporting system.
7. People
Who would be our point of first contact? Would our contact also
“sell” our brands to major accounts? What other brands is our
contact responsible for? How do we insure that we get our fair
share of attention from your sales force?
8. Business Planning Model
What would your action plan be if we made an agreement to
start with your company? First steps? 90 Day Plan? Reporting?
9. Cost to Serve
How do you model your distributor margin? Range
of margin for our brands? Are you open to promotional
spending split (50/50)?
10. Enthusiasm for our Company
Why is our brand a good match for your company?
Why are you the best partner in the market for our brand?
What commitment are you willing to make?
Talk to an Expert
• International Strategy Road Map
• Fix Problem Markets
• Entry Plans
• Find Distributors in 96 Countries
• Export Workshops
• Motivational Meeting Speaker
Contact Greg Seminara at (001)-404-255-8387 to discuss your business development project.
www.exportsolutions.com
48
Criteria (weighting)
Rating Evaluation Factors
Corporate Credentials 30%
Size, sales force, logistics, # employees.
Reputation (reference check existing brands).
National coverage.
Multi-channel coverage.
Category Expertise 20%
Sells brands in my category.
Shelf space for existing brands.
Current brands selling to target retailer.
Category analysis and insights.
Brand Building 15%
Ideas to build or launch my brand?
Marketing plan, cost, timing.
Success stories.
Cost to Serve 15%
Fair, transparent model relative to size
of business, brand investment, and
work required.
Enthusiasm
for My Brand 20%
Advance preparation, CEO involvement.
Follow-up on commitments.
Alignment with your vision.
X Factors: People, Admin.,
Professionalism, etc.
+/-
CPG/FMCG background for leaders.
Efficiency of scheduling meeting.
Office environment.
Do you enjoy the people?
Rating System
Rating Score
Excellent 5
Very Good 4
Average 3
Fair 2
Poor 1
Contact Greg Seminara at (001)-404-255-8387 to discuss your distributor search project.
www.exportsolutions.com
Export Solutions Distributor Assessment Grid
49
Distributor Trader Buyer
Services
Brand Builder of
third party brands
Buys and sells
products
Purchases direct
for supermarkets
Joint Business Plan Core No No
Retail Merchandising Yes No Shelf stocking only
Consumer Promotion Yes No Price reduction only
Focus Brand Building Short Term Profit
Lower prices through
Direct purchase
Issues
Many brands
needing attention
A local Distributor
handles most work
How to sell
to other market retailers?
Your Partners: Brand Builders vs. Buyers?
Six Steps Before You Hire
a New Distributor
3
Reference Check with their existing
brand owners.
3
Store visit to view in-store presence
for current brands handled.
3
Call at least one retail buyer for
a reference check.
3
Conduct a credit check through
Dun & Bradstreet
3
Search local legal records for lawsuits
against the company or owner
3
Secure independent local legal input
to the validity of your contract
Create Your Own
Export Library
All Guides available free at
www.exportsolutions.com
in the Export Tips section.
Distributor Search Guide
Export Handbook
Selling to USA Handbook
Distributor Management Guide
Finance & Logistics
Export Treasure Chest
My Favorite Templates & Forms
People Power
Strong Teams Build Great Brands
50
Is Your Distributor Best In Class?
Best in Class Distributor Average Distributor
Size Top 10 Supplier to Retailers. Top 100 Supplier to Retailers.
Coverage
Countrywide.
Offices outside Capital.
Major retailers only.
Technology
EDI, Web Portal,
Handhelds for sales reps.
Basic desktop capabilities.
Talent
Management:
Multi-national expertise.
“Home grown” talent.
Channel
Covers all channels
and small shops.
Major retailers only.
Marketing Full Brand Management services. Trade promotion only.
Retail Presence
Dominant presence at retail
for distributors brands.
Mixed presence at point of sale.
Cost to Serve Competitive, transparent model. Average cost to serve.
Logistics
Multiple warehouses.
24 hour delivery.
1 warehouse, 48 hour delivery.
Results Results exceed market growth. Results = market growth.
5151
1. Case
Manufacturer supplies a business case
confirming brand “aspirations” for the
country: Key items in portfolio, estimated
base pricing, volume/market share
expectations, and investment model.
2. Category Review
Distributor supplies a local review of
category competitors, pricing, and
merchandising practices.
3. Capabilities
Distributor shares detailed organizational
capability and customer coverage.
Could include references from existing
suppliers represented. An important step
when there are two or more candidates
under consideration.
4. Commitment and Costs
What is the Year 1 Plan and Forecast?
Targeted listings, marketing activities,
launch budget and volume estimate
associated with the spending plan.
5. Calculation – Value Chain
Line by line, build up from port to retail store
shelf. Include currency assumptions.
6. Compliance
Highlight product registration and
label requirements. Typical timelines
for compliance?
7. Captain of Team
Who will be our day-to-day brand manager or
first point of contact? Which senior executive
will serve as our “Brand Champion?”
8. Contract
Options include formal contract, letter
of understanding, or handshake deal.
Begin this process early!
9. Consumer Marketing
What are planned activities to generate
consumer trial and repeat purchases?
Trade marketing, consumer marketing,
social media, etc.
10.Calendar /Close
Distributor supplies a detailed timeline
of all activities. When can we expect first
order and delivery to support launch?
Frequent checkpoint calls or meetings.
10 C’s – Cooperation Model
Looking for Good Distributors?
Export Solutions’ database covers
9,200 distributors in 96 countries.
www.exportsolutions.com
52
Export Strategy Road Map Template
Countries Brands Partners
Strategic Priority Opportunistic
Mission
Lessons Learned
20/20 Analysis
Core Competencies
Big Opportunities
Low Hanging Fruit
Investment
Strategic Options
Strategic Plan
Tactics
Measures
Markets
Strategy questions? Contact Greg Seminara at Export Solutions (001)-404-255-8387
What are your business ambitions for the time period?
What factors have contributed to export success?
What situations have led to export disappointments?
What countries represent your top 20% performers? Why?
What countries represent your bottom 20% performers? Why?
What is your competitive advantage?
Why is your brand unique versus international competitors?
What are the biggest export opportunities for your company?
What represent high percentage, profitable opportunities?
What is your investment model? Marketing, Promotion, People.
What alternatives are available?
One page plan defining Objectives, Goals, Strategy, Measures
What activities are required to achieve desired results?
What are realistic measures and benchmarks?
5353
Business Case Template – Brand Owner
Request for Information – New Distributor
Activity
Comments
Brand Owner Profile
• Founding date, headquarter location
• Annual sales
• Category, point of difference,
international sales
Opportunity
• Anticipated Year 1, Year 3,
Year 5 revenues
• Market share aspirations
Product Portfolio
• Core items from product portfolio
Retail Price Range
• Estimated retail price or premium
vs. current category items
Channels/Customers
•
Target trade channels, customers
Marketing Budget
• Spending range or percent of sales
• Any contingencies
Marketing Activities
• Consumer promotion, sampling, media
• Trade promotion, listing fees
• Social media, community engagement
Launch Timing
•
Launch date
• Retail availability date
Information Required
• Category Review, Year 1 Business Plan
• Value Chain, Team Members
• Timeline

5454
Summary
CerealCo was founded in 1960 and is based in Atlanta, Georgia (USA). 2021 sales exceeded $300 million, including more than
$100 million in export sales to 25 countries outside the USA. CerealCo is a leader in organic/gluten free cereals.
Oppportunity
CerealCo’s goal is to achieve retail sales of $500,000 in year one, growing to $1 million by year three and $2 million by year five.
Market share objective is 15% of the premium international cereal category. The size of the prize translates to roughly $1.5 million
in distributor sales to retailers and $1.1 million in Cerealco sales to the distributor by year five.
Product Range
CerealCo offers a complete range of more than 30 organic, gluten free and sugar free cereals. For international markets, our six core
items are Organic (Original), Organic with Nuts, Organic Chocolate, Organic with Berries plus Gluten Free, and Sugar Free.
All core items available in a 300 gram size.
Retail Price
Approximate retail pricing is equivalent to $5 US dollars including VAT in local currency. This is consistent with other premium
international cereals and approximately a 20% premium to non-organic cereals. Our price list is attached.
Channels/Customers
Our year one focus is on the supermarket and natural foods channels. Initial targets are supermarkets catering to middle
and upper income consumers in the major cities. Year three aspiration is to expand to all supermarkets and launch into the
foodservice/horeca channel.
Marketing Budget
A provisional year one launch budget of $50,000 has been established. Ongoing marketing and trade support levels are projected
at the rate of 10% of distributor purchase value.
Marketing Activities
Distributor and CerealCo will agree on a joint business plan. Key components will include sampling and introductory price discounts.
A limited budget is established for listing fees at leading chains. However, it is CerealCo’s preference to offer “free goods” in lieu of a
listing fee. Launch plan will include ongoing social media campaign targeted against online communities appreciative of other organic
and gluten free products.
Launch Timing
Initial shipment – February. Sales Launch – March. Retail Availability – May. Marketing starts – June.
Information Required
Distributor should supply the following information within three weeks:
• Answers to key questions
• Cereal category review
• Year one business plan proposal
• Value chain: port to retail shelf
• Distributor proposed point of contact for CerealCo
• Timeline of key activities
*CerealCo is a fictitious company. Any resemblance to an actual cereal company is coincidental.
Sample Business Case Template- Brand Owner “CerealCo*”
Request for Information – New Distributor for CerealCo
Need more information? Visit www.exportsolutions.com.
5555
Ten Questions: Developing your Cooperation Model
1. Size of the Prize
What are the distributor’s year one and year three
volume estimates? How big is the category? Is the
category growing?
2. Key Account Listings
What listings can we achieve in year one? Who will
be our biggest customers? Will there be differences
in retailer acceptance by region or channel?
3. Trade Reaction
What will retailers like about our brand? Any potential
barriers? Which retailers will be most challenging?
4. Brand Manager
Who will be our primary point of contact?
Experience level? Workload?
5. Marketing Investment
What budget is requested to achieve our mutual
shipment objectives? Who pays for marketing costs?
Which costs are split?
6. Currency Fluctuation
What assumptions are made in your price calculation?
What happens if the currency fluctuates more than
5 percent in either direction? How do you handle
price increases?
7. Distributor Margin
What is your distributor margin? What services are included?
Any other fees or regular costs if we work together?
8. Trial and Repeat
What strategies are required to generate consumer trial
and repeat purchase? What works? How do you conduct
post-promotion analysis and measure payout and success?
9.Focus
Where will our company rank in terms of volume contribution to
your overall business? How will we secure share of mind during
our critical first year?
10. Issues
What are the biggest issues we will face? Barriers to success?
What must happen to win?
Talk to an Expert
• International Strategy Road Map
• Fix Problem Markets
• Entry Plans
• Find Distributors in 96 Countries
• Export Workshops
• Motivational Meeting Speaker
Contact Greg Seminara at (001)-404-255-8387 to discuss your business development project.
www.exportsolutions.com
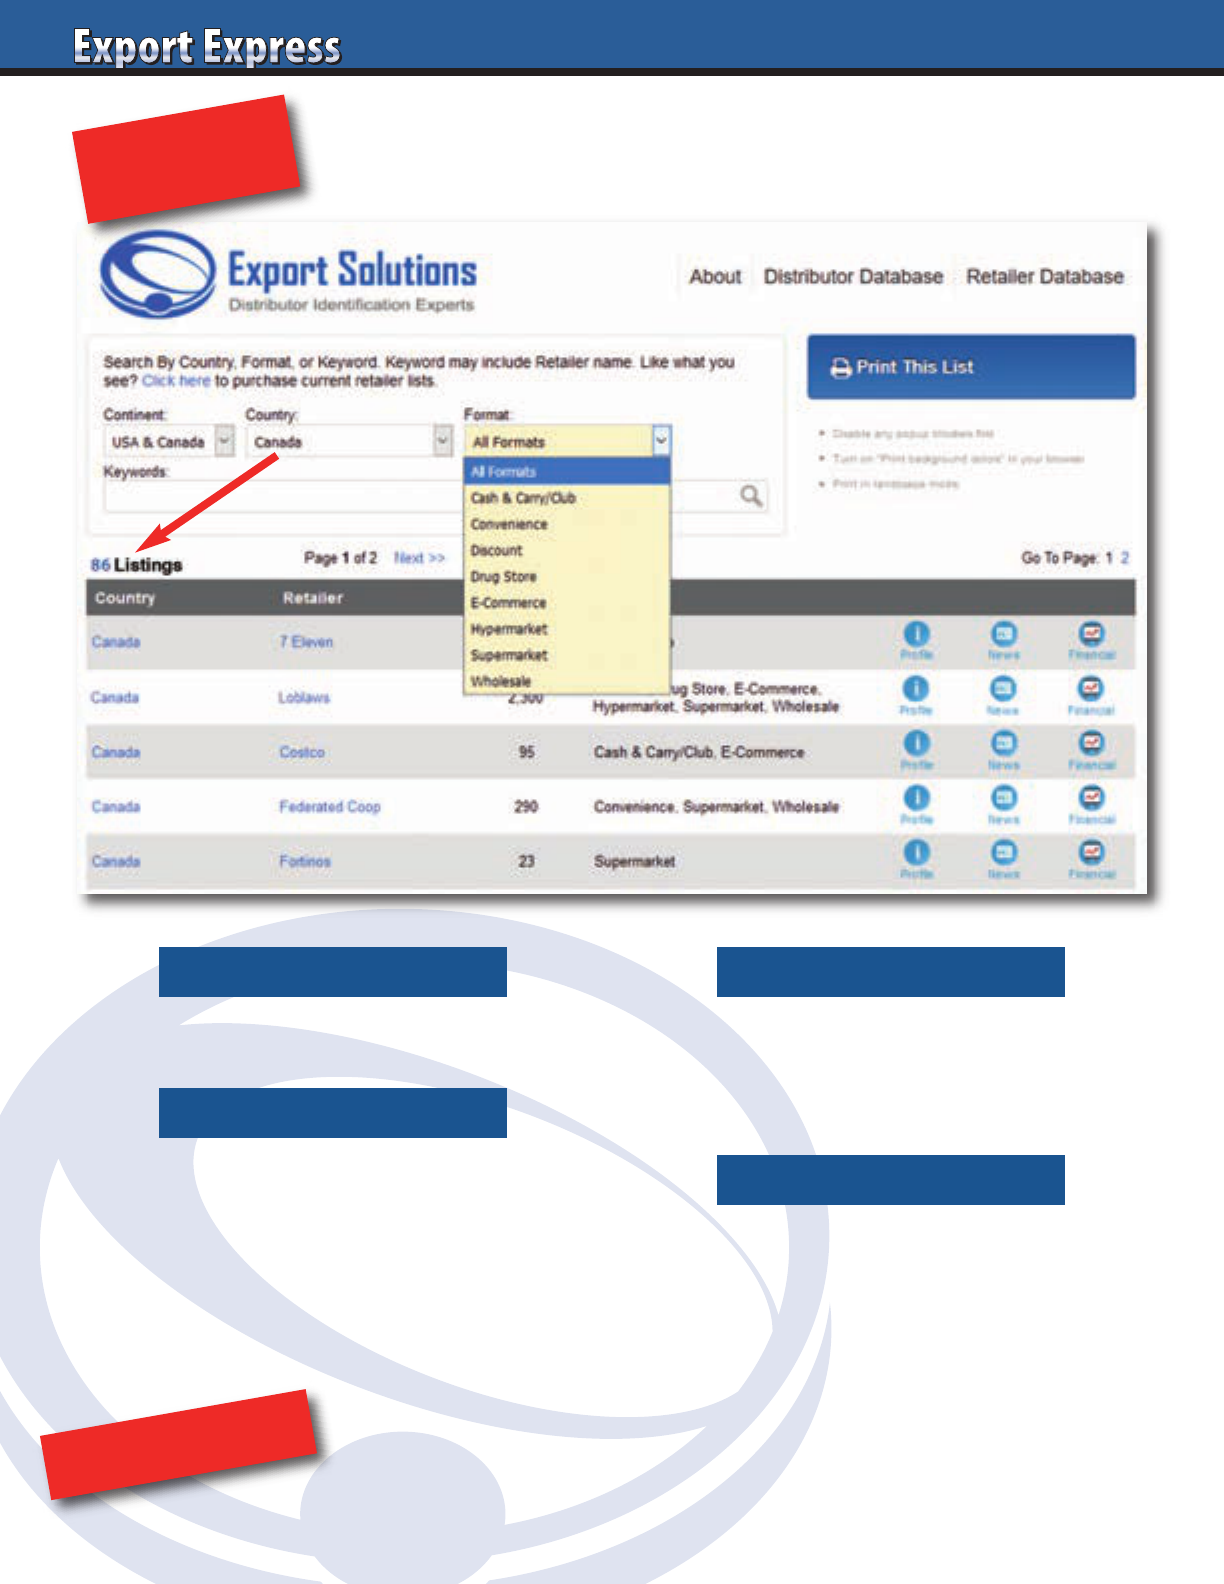
56
Coverage: 96 countries and 2,700 retailers
Supermarket
Convenience
Drug Store
Natural Food
Club, Cash & Carry
Supplying profiles, store counts, formats,
news and info for Top 100 international
retailers plus all overseas branches
Example 1: Who are supermarket
retailers in Canada?
Example 2: How many stores does Loblaws
operate by banner, in Canada?
NEW!
ORDER NOW!
56
Search by Retailer NameSearch by Country
Combo Search
www.exportsolutions.com
Search By Format
Retailer Search Made Simple
Canada Example

5757
Why did you create the retailer database?
Export managers dedicate a lot of time
to researching countries, retailers and
preparing business plans. A standard
KPI measure is tracking product listings
for key customers. I believe that our
industry could benefit from a global
retailer database to instantly locate
retailers and their store counts in
96 countries. The retailer database
is a logical extension of our leading
distributor database which has helped
more than 3,000 companies build export
sales during the last 10 years.
What is your geographic coverage?
96 of top 100 GDP countries worldwide.
This includes most Asian, Middle Eastern,
and European countries. Our database
covers every country in the Americas.
In Africa, we cover South Africa.
What is your format coverage?
Excellent coverage of chain supermarkets,
hypermarkets, clubs, cash and carry,
and convenience formats. Solid initial
coverage of drug stores, natural food
stores, and e-commerce channels.
Our database does not cover
DIY/hardware, toy, office, liquor,
or sporting goods channels.
Retailer database: featured info
Profile – Retailers profile and link to their
internet home page.
Formats – Retailer’s stores segmented
by format and banner.
We track supermarkets, hypermarkets,
cash and carry, convenience stores,
discounters, drug stores, natural food
stores, and e-commerce retailers.
News – Latest retailers’ news. In some
cases (Asia), we substitute a link to the
retailer’s latest promotional flyer.
Financial – Many leading retailers are
publicly traded. A link is provided to
their latest financial results. We do not
offer estimated financial information for
privately held or family owned retailers.
How is your coverage of global retailers?
We offer total coverage for top 100 global
retailers. This includes all of their
branches and banners. Searchable!
Use filters to research Walmart, Costco,
Carrefour, Tesco, Metro, Casino presence
by country. Database covers retailer’s
total store outlets as well as a breakout
by banner and format.
What can I use the retailer database info for?
• Obtain an instant snapshot of an
average of 24 retailers per country
for 96 countries.
• Track presence of global retailers like
Walmart, Carrefour, and Metro AG.
• Create country specific listing maps
where distributors measure brand
authorization by retailer.
• Conduct home office based
international category reviews and price
checks from retailers’ e-commerce sites
(not all retailers).
• Prepare annual reviews and reports
with up-to-date information on leading
retailers and channels.
Searchable
The database offers filters allowing you to
search by country, format, or retailer name.
You can also use a combination of filters for
your research.
Can I get a free sample of the retailer database?
Sure! Check www.exportsolutions.com for a
complete profile of United Kingdom retailers.
Do you provide retailer’s annual sales
or market share information?
Accurate annual sales information is
available through the financial link for
publicly traded companies. We do not
provide estimated financial information
for privately held and family owned
retailers. Channel blurring occurs between
supermarket, convenience, e-commerce,
and even natural food operators. We do not
provide market share due to difficulty to
accurately isolate and define channel
market share information, particularly with
so many privately held retailers.
How accurate is the retailer data?
Export Solutions’ retailer database is
updated weekly, so information is highly
accurate. Retailer names, web sites, and
formats rarely change. This makes the
database 99% accurate at the company
level. New stores open every day,
resulting in store counts that may be
95% accurate. We intend to update store
counts on a regular basis.
How much does retailer database access cost?
An annual subscription to the retailer
database is $975. This supplies one year,
unlimited access to more than 2,700
retailers in 96 countries. Special offers
available for our distributor database
customers. Note: special pricing for
government trade organizations.
How do I access the retailer database?
Visit www.exportsolutions.com and click
the retailer database page. You can place
a subscription or individual continent
(i.e., Europe) into a shopping cart.
Register and check out via credit card.
The process takes two minutes and we
automatically send you an invoice.
About Export Solutions
Export Solutions was founded in 2004
and is based in Atlanta, Georgia in the
USA. Export Solutions serves as a leading
provider of business intelligence to the
food and consumer goods industries.
Our distributor database covers 9,200
distributors in 96 countries and has been
used by more than 3,000 clients. Our
Export Express newsletter has a circulation
of 9,900 and is viewed as an important
source of insights, strategies, and
templates for international development.
www.exportsolutions.com.
FAQ’s – Retailer Database
58
Exporter Data Sheet
What Distributors want to Know about Your Company
New Business Opportunity: _____________________________________
(Company Name/Country)
Key Contact: Telephone:
Web Site: Email:
Founding Date: Ownership:
Annual Sales: Total Employees:
0-$50 million $50 million - $250 million $250 million- $1 billion $1 billion +
% Sales International:
0-10% 10-25% 26-50% 50% +
Exporter Classification/Description:_________________________ (#1-10, based upon Export Solutions’ scale)
Core Product Range:
Unique Selling Point:
Market Share:
Home Country: Country A: Country B: Country C:
Current Business in Distributor’s Country: Yes/No: Size $:
Current Customers (Distributor’s Country):
Investment Model: Listing Fees*: Yes/No *average $35 per item,per store
Trade Promotion Budget: Dead net price: 10% of sales: Mass:
Marketing: Digital: Sampling: 360 degree:
Ambition/Size of Prize: Sales: Market Share:
Year 1
Year 2
Year 3
59
What Distributors Want to Know?
Strong distributors are overwhelmed by calls from brand owners looking for new partners. Distributors assess
each opportunity carefully, as any new brand must add incremental sales and profits and not distract from
priorities from existing brands handled. What is the “size of the prize” for the distributor?
Assessment Criteria Facts Rating (10 = Best)
Your company: size/reputation
Existing business: sales in distributors country?
If zero “current sales,” what is realistic expectation?
Brand’s USP…your point of difference/innovation?
Size of investment plan: Marketing and Trade?
Potential distributor revenues?margin?
How does the product taste? (or peform)
How attractive/compliant is the packaging?
Pricing relative to category?
Brand success story in an adjacent country?
Competition intensity in category?
Brand range complexity?Product shelf life?
Local market research? Syndicated data?
Will brand invest in marketing and social media?
Will this be a tough product to launch?
Can we grow with the brand owner?
Your brand: core distributor category or adjacency?
Will the export manager be good to work with?
Will we be proud/excited to represent this brand?
What is the “size of the prize?”
60
New Country Launch – How Long It Takes
* Some activities may be completed concurrently
Minimum Typical
Research Distributor
Candidates, Schedule
Meetings with Lead Time
2 weeks 4-6 weeks
Distributor Meetings 2 days 1 week
Post Meeting Due Diligence 1 week 4-8 weeks
Distributor Appointment 1 week 4-8 weeks
Labeling Compliance already compliant 12-26 weeks
Product Registration* 1 week 4-12 weeks
Business Plan Development* 1 week 4 weeks
Contract/Agreement* 1 week 4-8 weeks
Initial Order Arrives 3 weeks 4-8 weeks
Key Account Calls 1 week 2-4 weeks
Key Account Acceptance 1 week 4-8 weeks
Retail Placement 2 weeks 4-8 weeks
Marketing Starts 1 week after retail availability 4-8 weeks
Consumer Sales
Repeat Purchase
Total 6 Months One Year

61
Does Your Distributor Network Need A Check Up?
Export Solutions Can Help!
• Distributor Network Assessments
• Motivational Speeches
• International Strategy
• Find Distributors in 96 Countries
Contact Greg Seminara at [email protected] or (001)-404-255-8387.
www.exportsolutions.com
Exporters manage distributor networks extending to 20, 50, 70 countries or more!
Every company has a few distributors that under perform.
“Under achievers” prevent us from attaining our personal objectives.
Distributor Network Check Up
• Independent assessment from Export Solutions
• Establish methodology for ranking Best in Class distributors and “Laggards”
• Supply strategies for recognizing top distributors
and upgrading the bottom performers
• Benchmark external brands from your category
• Practical and “action oriented” approach
Foodservice/HORECA Capability Assessment
Assessment Criteria Capability – Results
Foodservice: Percent of total distributor sales
Dedicated Foodservice Team? Structure?
Foodservice Channel Principals (list):
Refrigerated/Frozen Warehouse/Delivery
Chef on staff?
# of Operator Calls (monthly)
# Foodservice Sales reps. Chef background?
Foodservice: Percent sales by segment:
Hotels
Restaurants: “High End”
Restaurants: “Quick Serve”
Catering, Canteens
Institutions: Hospitals, Schools, Prisons
Theaters, Stadiums, Theme Parks
Airlines, Cruise Ships
Bars, Pubs, Nightclubs
Foodservice: Top 3 customers
Trade Show Participation
Creative Marketing: Menu Ideas?
Tabletop/“Front of House” presence
Foodservice Sub-Distributor Partners:
Nutritionist, Food Technologist?
Foodservice annual sales growth vs. overall market
62
Small Shops (Traditional Trade)
– Capability Assessment
Assessment Criteria Capability – Results
Traditional trade: percent of total distributor sales
Dedicated traditional trade team? Structure?
Top 5 principals: traditional trade
# Vans and DSD trucks? Owned?
# Traditional trade reps. Exclusive or shared?
Sales rep. compensation (fixed/variable/bonus)
Customer coverage, segmentation, frequency
# Customers invoiced monthly
Average order size
# items sold per order
# calls per day
How do you establish call priorities?
Measures/KPI’s
Retail reporting capabilities
How do you drive traditional trade volume?
Creative trade marketing ideas?
Sub-distributors or wholesalers used?
Cost to serve?
New item launch process
Traditional trade growth versus market?
63
64
Cost to Serve: 5 Factors to Consider
Manufacturers must perform self analysis
to understand the costs required to service
their business:
1. How complex is your product line?
One category with 3-5 items is relatively
simple to manage. Or is your company in
many categories with 50-100 items to sell,
inventory, deliver, and merchandise in-store?
2. Logistics: Single largest cost for a distributor.
Freight and warehouse handling complexity
can vary widely by manufacturer. Key
factors include product cube, shelf life, sales
turnover, and typical order. Temperature
controlled logistics usually adds 5-10 points
of margin.
3. Retail Intensiveness. Certain brands
compete in large categories (confectionery/
drinks) with fierce competition for shelf
space. This demands constant attention
by the distributors/brokers sales force on
every store visit. Other brands require little
ongoing retail attention. In these cases,
distributor personnel must simply verify
that authorized brand sizes are available
at each store.
4. Seasonal Brand versus Year-Round Sales?
Naturally, it is easier for a distributor to
service a brand that has a narrow selling
season (Christmas Holiday) than a brand
requiring year-round focus.
5. Manufacturer Involvement and Visibility.
Does the brand require a dedicated brand
manager in the distributor to handle day-
to-day activities? How involved is the
brand owner? Do you speak to him daily
or several times per year? What is the
frequency of brand owners request for
information/reports and market visits?
Pioneering New Brands is Expensive
Brands new to a country bring no
immediate income and are risky for a
distributor. As a result, brands requiring
pioneering frequently experience higher
margins for distributor services. This
surcharge is driven by the fact it may take
up to a year from start until the distributor
derives a meaningful sales level and is paid
for his shipments of your new product.
Market entry planning can take 3 months,
followed by another 3-4 months to sell in
to retail availability. Marketing activities
begin and may take 2-3 months to generate
meaningful sales levels followed by retailer
payment 30-90 days later. Thus, a distributor
may be investing his organization’s
resources for one year before he gets paid!
In some cases, a manufacturer will offer
the distributor or broker a small, monthly
fixed retainer fee during the launch
planning period. This supplies income for
resources allocated before your partner
receives payment.
Marketing Investment:
How Much and Who Pays?
Brands with a strong financial
commitment to marketing should
generate higher sales for the distributor.
Marketing investments include spending
for consumer awareness activities such as
advertising and sampling, as well as trade
development events such as listing fees,
special displays, and in-store campaigns.
Brands with strong marketing budgets
typically enjoy lower margin structures.
In some cases, the distributors agree to
share the marketing costs as part of their
margin calculation. This practice may
apply to large brands or new products.
Distributor sharing of marketing
expenses may result in a slightly
higher margin, but also in increased
accountability, efficiency and a unique
sense of partnership.
What is the Size of the Prize?
Margins and commissions represent your
partner’s "salary." Brands with existing
business deliver immediate and reliable
cash flow. Most distributors’ costs
are fixed: sales force, warehouse,
management, administration, etc. Brands
with current sales deliver incremental
profits for the distributor by leveraging
the distributors’ existing infrastructure.
The distributor must offer a competitive
margin to attract these brands to deliver
a cost savings versus the brands current
organizational strategy. Manufacturers
with significant existing business are in
a strong negotiating position.
Bonus Incentives Versus Scale Discounts
Supplemental compensation schemes
may be used to incent distributors/
brokers or to obtain cost savings once
certain volume thresholds are reached.
One approach is to pay a bonus based
upon reaching critical annual sales
targets. In other situations, manufacturers
may structure margin calculations to
receive rebates/margin reductions once
business reaches a certain sales level. For
example, reduction of margin from 25%
to 23% once 3 million in sales are reached,
20% once 5 million in sales are reached.
Other plans call for a reduced margin
only on levels exceeding the thresholds.
For example 25% margin on first one
million in sales, 22% margin on sales
above one million.
Distributor Margins & USA Broker Commissions: What’s Fair?
Short Answer – Prevailing Rates*
12-20% Distributor Margin Leading companies with sizable budgets:
consumer marketing and trade promotion
20-30% Distributor Margin Mid-size companies with some investment:
marketing and trade promotion
30-50% Distributor Margin Niche brands or start-ups with little or no
upfront marketing investment
2% USA Broker Commission Leading companies/brands – full service
(HQ sales + retail)
3-5% USA Broker Commission Average size brands – full service
(HQ sales + retail)
5- 10% USA Broker Commission Niche brands or “start-ups” requiring
full service
Distributor margins do not include optional distributor contributor to trade promotion
*Distributor margins and broker commissions can vary based upon local factors such
as retail requirements, logistics costs, financing fees, and complexity of servicing a
manufacturers business. Contact Export Solutions to discuss typical margins/com-
missions for a specific country or brand.
Price Calculation Worksheet
Item Amount Comments
List Price (factory or port)
Compare to your domestic list price?
Avoid diverting risk.
Exchange rate Watch bank rate vs. distributor rate.
Freight (sea, truck or rail)
Target full containers.
Consolidation is costly.
Duties
Apply correct Harmonized (HS) code.
Confirm Free Trade Agreements.
Customs clearance, insurance Money and time!
Inland freight: port to distributor
Translate actual costs to case rate.
Avoid flat percentage rates.
Landed Cost
Product Stickering Select countries.
Listing Fees
Flat fee. One time only.
Usually not in calculation.
Marketing fund accrual
Typically, 10-20% of list price.
Part of calculation or manufacturers price.
Distributor Margin
Normal range: 15-35%.
Depends on size, complexity of brand, services,
and “what trade spend is included.”
Other Distributor Fees
Should be part of distributor margin.
Avoid hidden profit centers.
Price to Retailer
Fair and transparent model.
Incentives for large customers, extra performance.
Retailer promotions, incentives,
rebates
10–20% depending on the country.
Other Retailer Fees
At times for merchandising or central distribution.
Should be allocated from distributor margin.
Retailer Margin
Global average: 28%
Range: 15%-45% based upon category, brand.
Sales Tax/VAT
Included in price in many countries.
USA sales tax is on top of shelf price.
Consumer shelf price Everyday prices and promotional prices.
65
66
Tactical Exports vs. International Brand Building
What are your realistic aspirations for a country? There is a big difference between tactical exports
and strategic brand building. Companies can win in smaller countries with an “export only” strategy.
Brand building requires a financial commitment. Either option works. Companies need to align
market ambitions with their investment plans.
Export Brand Building
Market Research None Local consumption habits
Product portfolio Best sellers from home market Tailored to country/region
Packaging Standard packs stickered Native language
Factory Corporate headquarter based Offshore
Marketing Investment
Trade marketing only (10 percent of sales?) TV, 360 marketing 20-30 percent of sales
Retail Pricing Premium to super premium Equal to competitors
Route to Market Distributor Direct team or distributor
Oversight Periodic visits Dedicated country manager
Market Share Ambitions Niche Player
Complexity Low High
Export Countries Brand Building Countries
Middle East USA
Caribbean Western Europe
Malta, Cyprus, Portugal Mexico
Central America China
Hong Kong, Singapore Japan
Taiwan India
Nordics Russia
Baltics Turkey
Chile, Peru, Ecuador Brasil
67
Category Review Template* – page 1
(Estimate: Source info from Store Checks, Retailers, Nielsen, Euromonitor)
*Note: please provide your best estimate
Category Sales: Total, all channels, all customers
Retail Value _______________________________ Wholesale value___________________________
Category Sales: Percent by Segment
Segment A _________ Segment B _________ Segment C _________ Segment D _________
Category Sales: Percent by Channel
Supermarket _________ Convenience _________ Discount _________ Pharmacy _________
Wholesalers _________ Cash & Carry _________ E Commerce _________ Other _________
Category Peak Seasonality
Summer _________ Winter _________ Holiday _________ None _________
Category Sales: Top 4 Customers
Customer 1 _________ Customer 2 _________ Customer 3 _________ Customer 4 _________
Category Sales: Percent National Brand versus Private Label
National Brand _________ Private Label _________
Category Sales: Percent by Brand
Brand A _________ Brand B _________ Brand C _________ Brand D _________
Category Sales: Percent by Region
Region A _________ Region B _________ Region C _________ Region D _________
Category Sales: Market share (value) Top 4 Brands
Brand 1 _________ Brand 2 _________ Brand 3 _________ Brand 4 _________
Category Sales: Market share (units) Top 4 Brands
Brand 1 _________ Brand 2 _________ Brand 3 _________ Brand 4 _________
Category Sales: Top 4 SKU’s/Items
Item 1 _________ Item 2 _________ Item 3 _________ Item 4 _________
Category Sales: Top 4 Pack Sizes
Pack Size 1 _________ Pack Size 2 _________ Pack Size 3 _________ Pack Size 4 _________
68
Category Review Template* – page 2
(Estimate: Source info from Store Checks, Retailers, Nielsen, Euromonitor)
*Note: please provide your best estimate
Category Size (circle)
Mass Standard Niche
Category Sales Growth (circle)
High 10 % + Average: 3-5 % Flat Declining
Buyer Interest (circle)
High Medium Low
Category Development (circle)
New High Growth Mature Declining
Retail Prices: Top 15 SKU’s/Items at number 1 customer
Item 1 _________ Item 4 _________ Item 7 _________ Item 10 _________ Item 13 _________
Item 2 _________ Item 5 _________ Item 8 _________ Item 11 _________ Item 14 _________
Item 3 _________ Item 6 _________ Item 9 _________ Item 12 _________ Item 15 _________
Shelf Space: Provide Photo’s/Planograms
Typical Section Size: Supermarket # Items: Average supermarket
Adjacent Category 1 Adjacent Category 2
Merchandising (circle)
Typical Percent
Price Reduction
10% 20% 30% Other
Store Flier
Participation
weekly monthly seasonal never
Category displays weekly monthly seasonal never
Special Packs Bonus Packs Pre-Price Free Gift Other
What activity drives incremental category sales?
Category Insights: What’s hot?
Category Insights: What’s not selling well?
Category Summary/Other Insights
69
Retailer
Your
Brand
Share
Share
of
Shelf
Eye
Level
(yes
or no)
Next to
Brand
B
Key
Item
$2.99
Price
Gap vs.
Private
Label
Comments/Plans
Walmart SC 35% 42% Yes No 2.69 + .50 Shelf review September
Kroger 35% 28% No Yes 2.99 + .30
Increase shelf share
to minimum 35%
Albertsons 35% 25% No No 3.19 + .20
Increase shelf share
to minimum 35%
Publix 35% 45% Yes Yes 2.99 + .20
Maintain space
in new schematic
Country Shelf/Pricing Tracker – USA Sample*
*Complete for all countries/retailers
Country Listing Map – USA Sample*
*Complete for all countries/retailers
Retailer Stores SKU 1 SKU 2 SKU 3 SKU 4 SKU 5 Comments/Plans
Walmart SC 3,571 x x x
SKU 3 stocked
at 2,000 Supercenters
Kroger 2,726 x x x x Category review November
Albertsons 2,278 x x x x New shelf set
Publix 1,300 x x x Present SKU 4: July
Talk to an Expert
• Find Distributors in 96 Countries
• International Strategy Road Map
• Fix Problem Markets
• Next Level Sales Management
• Export Workshops
• Motivational Meeting Speaker
Contact Greg Seminara at (001)-404-255-8387 to discuss your business development project.
www.exportsolutions.com
70
Launch Plan Proposal – Year One*
Brand Objective
Volume: _______________ Wtd. Distribution: _______________ Share: ________
Consumer Marketing Activities
Activity
1.
2.
3.
Rationale Cost
Trade Marketing Activities
Activity
1.
2
3.
Volume Cost
Listing Fees
Customer
1.
2.
3.
# SKUs, Space, Promotion Support Cost
Total Year One Volume Total Year One Cost Wtd. Distribution
Distribution Achieved with Above Spend Level
Customer
1.
2.
3.
Stores % Country # SKUs Volume (annual)
*Feel free to attach other pages to support your recommended launch plan.
71
Subscribe now at www.exportsolutions.com
Country Experts
Looking for distributors specialized in brands from your country?
Search Export Solutions database to find overseas distributors handling
food, beverage, and sweets brands from your country.
USA Food & Sweets
1,189 Distributors
Spanish Food & Sweets
408 Distributors
Italian Food & Sweets
1,397 Distributors
UK Food & Sweets
682 Distributors
Latam Food & Sweets
543 Distributors
German Food & Sweets
648 Distributors
72
Create Your Own Export Library
Looking for a fresh point of view for your
next event or training workshop?
Contact Greg Seminara at
greg@exportsolutions.com
All guides available free at www.exportsolutions.com.
Export Strategy Guide
Distributor Search Guide
Export Handbook
Selling to USA Handbook
Distributor Management Guide
Finance & Logistics
300 Tips for
Export Managers
Idea Guide:
New World – New Business
Export Treasure Chest
My Favorite Templates & Forms
People Power
Strong Teams Build Great Brands
New Distributor
Cooperation Model
73
Exporter Data Sheet
What Distributors want to Know about Your Company
New Business Opportunity: _____________________________________
(Company Name/Country)
Key Contact: Telephone:
Web Site: Email:
Founding Date: Ownership:
Annual Sales: Total Employees:
0-$50 million $50 million - $250 million $250 million- $1 billion $1 billion +
% Sales International:
0-10% 10-25% 26-50% 50% +
Exporter Classification/Description:_________________________ (#1-10, based upon Export Solutions’ scale)
Core Product Range:
Unique Selling Point:
Market Share:
Home Country: Country A: Country B: Country C:
Current Business in Distributor’s Country: Yes/No: Size $:
Current Customers (Distributor’s Country):
Investment Model: Listing Fees*: Yes/No *average $35 per item,per store
Trade Promotion Budget: Dead net price: 10% of sales: Mass:
Marketing: Digital: Sampling: 360 degree:
Ambition/Size of Prize: Sales: Market Share:
Year 1
Year 2
Year 3
74
Driving export development requires a balance of headquarter resources and people “waking up”
in the country they are managing. Export Solutions shares 12 key roles required to partner effectively.
Noted: Export managers create miracles, with one person handling many functions!
Who, What, & Where
Role Work Location
VP/General Manager
• Develop export strategy
• Obtain resources for team
• Deliver annual results
Headquarters
New Business Development
• Prioritize expansion countries
• Due diligence on new partners
• Close new business deals
Headquarters
E-Commerce Manager
• Create e-commerce strategy
• Develop export tool kit
• Train distributor teams
Headquarters
Distributor Management
• Establish local priorities
• Train distributor teams
• Distributor customer service
• Deliver annual results
Regional
Supply Chain Manager
• Deliver distributor orders
• Manage forecast
• Distributor customer service
Headquarters
Regional
Trainer
• Share best practices
• Support new launches
• Company “missionary”
Headquarters
Digital Marketing Manager
• Develop/distribute content
• Train distributor teams
• Maintain digital portal
Headquarters
Trade Marketing Manager
• Develop local promotions
• Facilitate distributor execution
• Analyze results
Regional
Consumer Marketing Manager
• Develop global strategy
• Conduct market research
• Drive new product pipline
Headquarters
Regional
Category Analyst
• Analyze Trends
• Identify opportunities
• Calibrate “size of prize”
Headquarters
Regional
Finance Manager
• Manage risk
• Monitor receivables, f/x
• Deliver financial results
Headquarters
Compliance Coordinator
• Facilitate regulatory, registration,
trademark, and packaging
Headquarters

75
Distributor Capability Assessment
Export Solutions established 15 assessment criteria to identify “Best in Class” performers as well as “under
achievers.” Many distributor relationships extend 10 years or more. Is your distributor network still a “good fit”
for your current business requirements? Template can also be used as New Distributor Reference Check form
.
Assessment Criteria Rating: (10 = Best)
Category Expertise/Critical Mass
Focus/Time Dedicated to your Business
Joint Business Plan Development, Execution, Delivery
Alignment with Brand Owners Vision. Relationship.
Cost to Serve (fair margin, extra costs)
Assortment/Shelf Space
Promotion Creativity, Effectiveness, and Efficiency
Key Account Relations (Senior level, buyer)
Leadership/Owner (engaged & committed to us?)
Brand Manager (seniority, clout,creativity)
Multi Channel, Multi Regional Coverage
Financial Stability, Payment Record
Supply Chain Management & Forecasting
Problem Solving: rapid response?
Sales Results versus Budget, Market, Category (CY, PY, 3 Years)
76
Export Lessons Learned Template
Why are Countries Leading or Lagging?
(Complete based upon your company performance)
Leading
Countries
Lagging
Countries
Country Performance:
Measure: sales per capita
Brand Development:
Measure: market share
Biggest Opportunity
Countries:
Measure: category size/growth
Promotion Effectiveness:
Tactics creating incremental sales
Distributor Performance:
Measure: sales increase,
commitment
77
Year One Scorecard Example
Brand owners and distributors enter new relationships with great expectations.
Most partnerships succeed, but some under deliver leaving both parties disappointed.
Export Solutions Year One scorecard helps both parties align on KPI’s.
Objective Goal Results
Shipments to Distributor
Distributor Sales to Customers
Top 5 Customers
Region: Sales Split by Area
Channel: Sales Split by Channel
Market Share
Listings: Top 5 Customers
Retail Pricing
Shelf Positioning
Shelf Space
Sampling
Social Media
Displays
Manufacturer Investment
Brand Manager Performance
78
Channel Confectionery
Gourmet
Food
Food/Grocery Beverage Non Food
E-commerce x x x x x
Meal Kits x x x
Ethnic – “Homesick” x x x x
Gift Basket x x x
Natural Food x x x
Gourmet, Deli x x x
Liquor x x
Farmers Markets x x
Gift Channel x x
Toy, Party Stores x x
Movie Theaters x
Hardware, DIY, Office x x x
Duty Free x x x
Fundraising x x
Theme Parks, Stadiums x x
Airlines x
Butchers, Fishmongers x x x
Coffee Shops x x
Military x x x x x
Department Stores x x
Kitchen Supplies x x x
Dollar, Close Out x x x x x
Discount Clothing
(Marshalls, TJ/TK Maxx)
x x
New Channels: Prime Prospects, By Category
What Makes a Great Distributor CEO?
CEO Assessment Considerations
Rating:
(10 = Best)
Achieves Joint Business Targets • Committed and dependable.
Dedication to Your Business • Knows details. Visits your HQ.
Willing to Invest
• People, technology, brand building.
Strong Customer Relations
• Senior contacts at top retailers.
Relationship With Brand Owners
• From export manager to CEO.
Response Time
• Same day to one week?
Thinks Like A Marketer • Creative, brand building ideas.
Frequent Visits: Retail Stores
• Good grasp of retail conditions.
Problem Solving
• “Hands on,” responsive.
Compound Annual Growth Rate • Flat to 10% or more.
Cost to Serve Transparency
• Detailed understanding of costs.
Celebrates Team Success
• Awards, promotions, raises.
CPG/FMCG Background • Senior level external experience.
Years of Service
• New to 20 years or more.
Local Industry Leader • High profile in community.
Work Ethic
• Office time vs. overseas trips?
Information Technology (IT)
• Invests in “best in class” IT.
Ethical and Trustworthy • Principled, respected partner.
Respects Manufacturer’s P & L • Sells profitable cases.
Relationship: Entire Team
• Finance, logistics, adminstration.
79
80
Brand Manager Assessment
Your distributor Brand Manager represents your key day to day contact. Successful Brand Managers are good
partners and deliver results, not excuses. Is your Brand Manager an experienced veteran or new hire (rookie)?
Assessment Criteria Rating: (10 = Best)
Years industry/distributor experience
Years sales/commercial experience
Reports to owner or senior leadership team
Workload: dedicated or shared with many brands
Responsiveness: gets things done quickly!
Category knowledge: technical, competition
Analytical skills: shipment trends, Nielsen data
Problem solving
Develops creative promotions
Reports: accurate and on time
Enthusiasm for your company and the business
Participation on customer calls, store checks
Forecast accuracy
Influence distributor team: focus on your priorities
Delivers/exceeds shipment objectives
81
Analyze: Your Contribution to Distributor Profit
Export Solutions: 20 Factors Driving Distributor Profitability
Assessment Criteria
Considerations
Result
Rating:
(10 = Best)
Annual Sales Revenue • Percent total distributor sales
Annual Margin Generated ($) • Net sales times gross margin
Distributor Percent Margin
• 10 percent to 50 percent
Brand Owner Investment Level
• Percent of distributor purchases
Distributor Margin Re-Investment
• Distributor promotion spending
Category Adjacency • Distributor portfolio synergies
Brand Market Share
• Niche versus market leader
Payment Terms
• Pre-pay versus 120 day terms
Safety Stock Requirements • Two weeks to four months
Typical Customer Order • One case to full truck
Shelf Life • Two weeks to five years
Case Cube/Case Cost • “Low cube, high case cost best”
# Brands/Items in Range
• “High sales, fewer items valued”
Logistics/Storage: Temp?
• Ambient versus chilled
Damage/Expired Goods • None to 20% of sales
Category Competition
• Niche to highly competitive
Labor: Battle for Shelf Space
• None to intense fight
Brand Manager
• Shared or dedicated
Admin Requirements • Orders only to multiple reports
Manufacturer Visit Frequency
• Never to weekly
82
Field Sales – Coverage Frequency Template
Retailer #/Stores Daily Weekly Bi-Weekly Monthly Never
Sample Chain 200 0 50 100 40 10
Country Listing Map – USA Example*
“Required Template for Every Country”
*Instructions: List top 10 customers for every country. List all your key SKUs (items).
“X” indicates item stocked at customer. Blank space represents a distribution void.
Retailer Stores Sku 1 Sku 2 Sku 3 Sku 4 Sku 5 Comments/Plans
Walmart SC 3,571 x x x
Sku 1, 2, 3 stocked at only
2,000 Supercenters
Costco 575 x Special sku 5 for Costco
Kroger 2,726 x x x x Category Review March
Albertsons 2,278 x x x New shelf set
Publix 1,300 x x x BOGO Ad November
Ahold-FL 2,050 x x x x New sku 4 listing
HEB 355 x x x Category Review March
Meijer 260 x x x x Holiday Display Program
83
Field Sales – Capability Assessment
Number of sales offices (list locations)
Total field sales representatives (or merchandisers)
Number of sales reps outside capital area
Number of field sales supervisors
# Full time representatives vs. # part time
Average years of service: representatives
Average stores per representative
# stores visited per day
Average time spent per store, per day
Do you have multiple reps visiting each store?
# SKUs handled per sales rep
# priorities per store visit
# sales reps with laptop or tablet
# sales reps with phone with reporting capability
Compensation: percent fixed vs. variable?
84
Who Is My Team?
Big distributors feature large teams with strong capabilities.
Manufacturers want to know who is their functional contact and how much time do they dedicate to my business?
Function
Distributor
Contact
Title
Email
Phone
(Mobile)
Senior
Management
(Owner/MD)
Marketing
Manager
Sales Manager
Brand Manager
Field Sales
Manager
Digital Marketing
Finance
Supply Chain
Purchasing
(order placement)
Accounts Payable
Compliance/
Registration
Customer
Service Manager

85
Logistics-Distributor Capability Scorecard
Many retailers supply their distributors with service level scorecards. Our distributor’s performance demonstrates their reputation as
a reliable supplier to important customers. Benchmark results vary by country, reflecting unique requirements to serve local customers.
Assessment Criteria Capability – Results
Warehouse: Distributor owned or outsourced to third party?
Trucks/vans: Distributor owned? How many, by type?
Warehouses: Locations, size, pallet positions,temp.controlled?
Special pack services: Stickering, promo packs, repack?
Average stock on hand: number weeks supply, by SKU
Annual inventory turns
Order lead time: capital city, rural regions
Minimum order size: cases, value, avg. order size
Perfect order rate, case fill rate, SKU fill rate
On time delivery rate
Monthly orders handled? Unique customers?
Damaged goods: Percent of sales
Vendor Managed Inventory (VMI) customers
Can distributor ship less than case quantities?
Logistic cost: percent of net invoiced cost
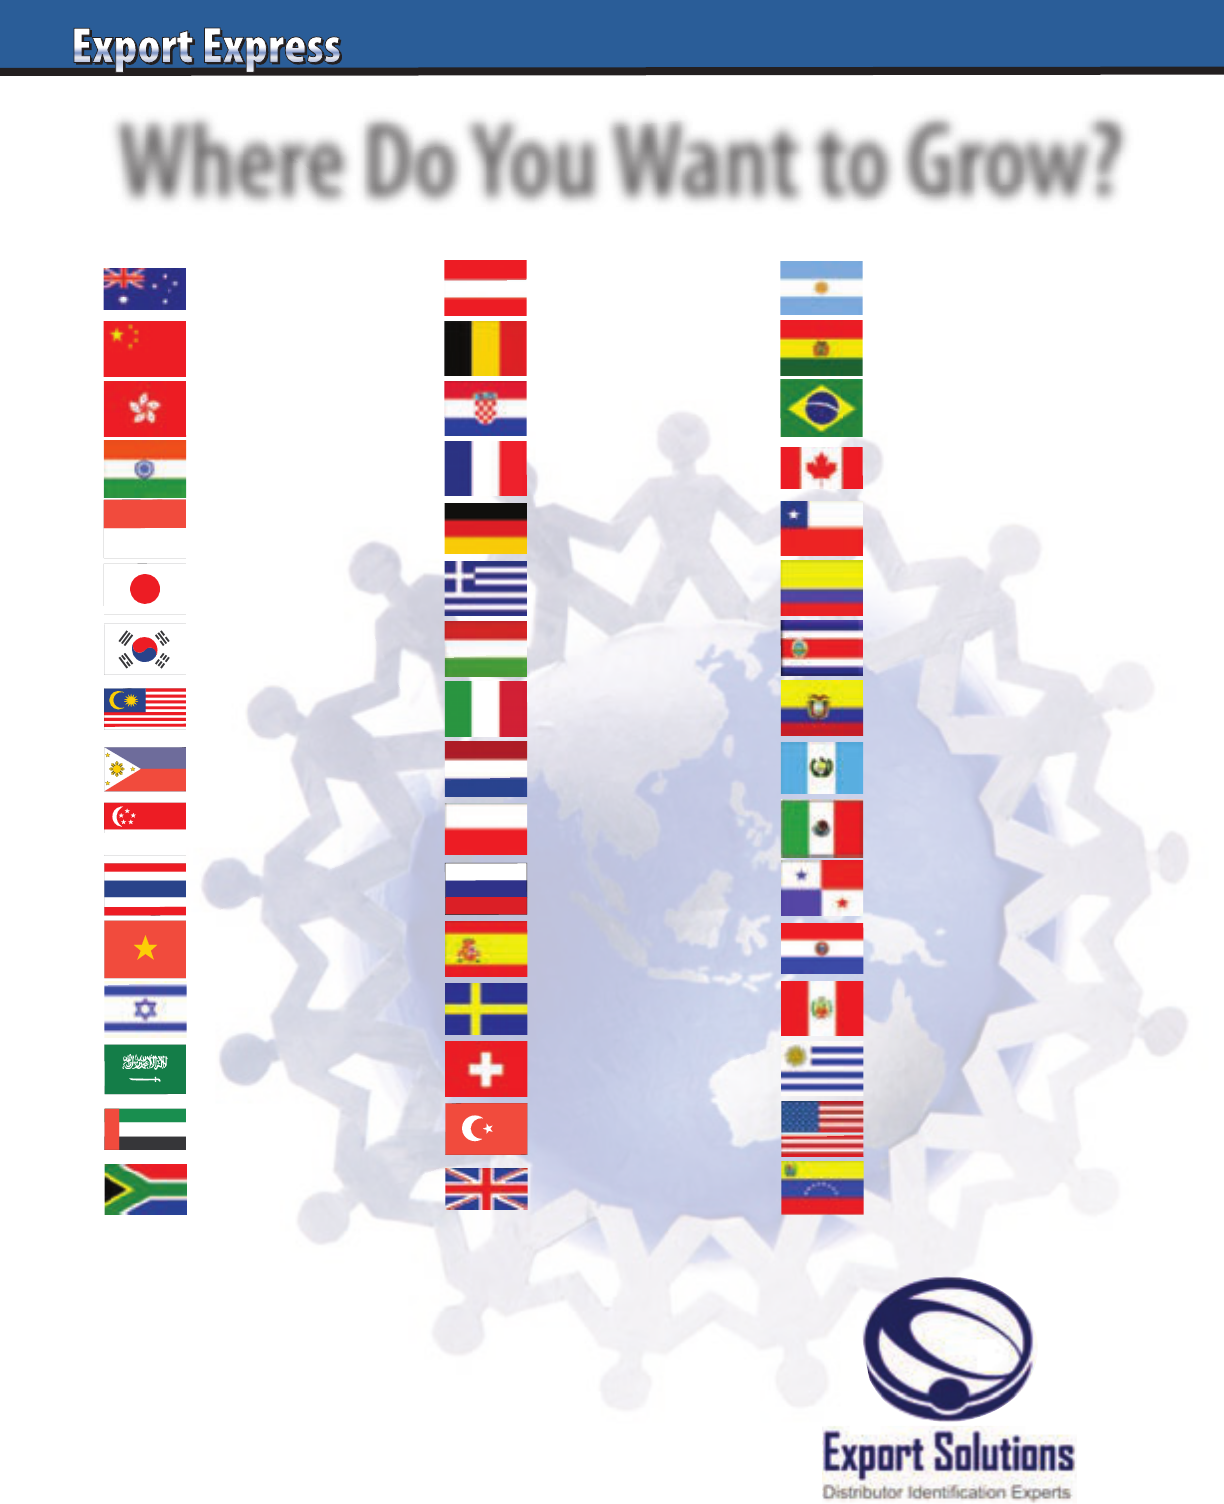
86
Where Do You Want to Grow?
Asia/Africa/Middle East
Europe Americas
Use Export Solutions Database
to fill in the Gaps in your
Export Coverage Map
Australia – 274 Distributors
China – 160 Distributors
Hong Kong – 177 Distributors
India – 109 Distributors
Indonesia – 78 Distributors
Japan – 176 Distributors
Korea – 146 Distributors
Malaysia – 128 Distributors
Philippines – 109 Distributors
Singapore – 163 Distributors
Thailand – 94 Distributors
Vietnam – 49 Distributors
Israel – 61 Distributors
Saudi Arabia – 115 Distributors
U.A.E. – 195 Distributors
South Africa – 106 Distributors
Plus 14 more countries
Austria – 68 Distributors
Belgium – 85 Distributors
Croatia – 78 Distributors
France – 125 Distributors
Germany – 188 Distributors
Greece – 90 Distributors
Hungary – 68 Distributors
Italy – 105 Distributors
Netherlands – 155 Distributors
Poland – 90 Distributors
Russia – 108 Distributors
Spain – 157 Distributors
Sweden – 103 Distributors
Switzerland – 100 Distributors
Turkey – 82 Distributors
U.K. – 274 Distributors
Plus 19 more countries
Argentina – 61 Distributors
Bolivia – 52 Distributors
Brazil – 135 Distributors
Canada – 205 Distributors
Chile – 92 Distributors
Colombia – 82 Distributors
Costa Rica – 73 Distributors
Ecuador – 55 Distributors
Guatemala – 61 Distributors
Mexico – 193 Distributors
Panama – 63 Distributors
Paraguay – 57 Distributors
Peru – 82 Distributors
Uruguay – 52 Distributors
USA – 598 Distributors
Venezuela – 38 Distributors
Plus 14 more countries